The Siemens Community Catalyst program was co-created with our community to acknowledge technology leaders who consistently contribute to the Siemens Community. Nominations are accepted on a rolling basis.
Hi!
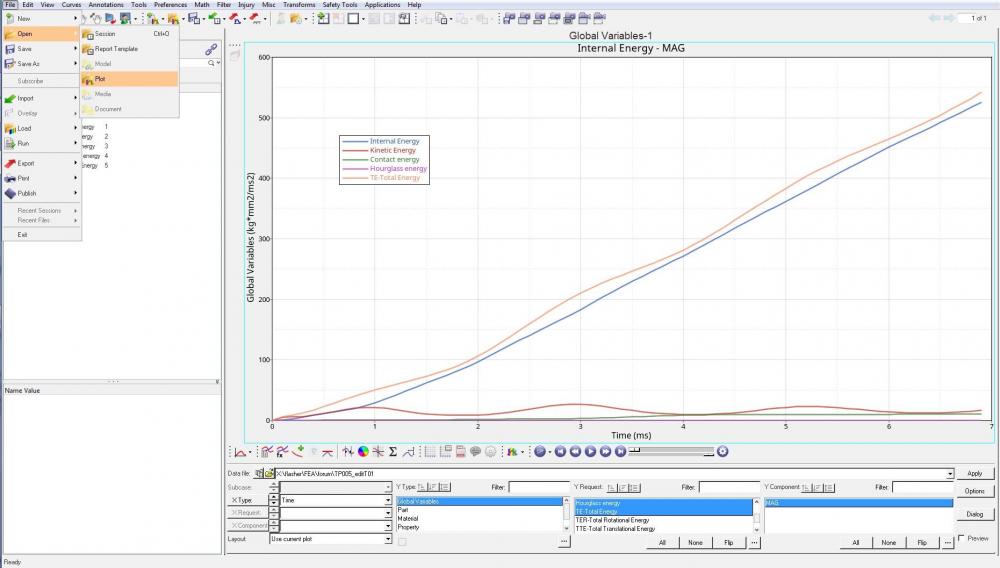
I am performing crash analysis and I want to see the energy balance over the time interval.
However, I am unable to see the energy balance in Hypergraph though I have selected the appropriate control cards and data history options.
Please help!
Thank You!
Unable to find an attachment - read this blog
Hi,
Hyperview can be used to post-processing animations files. Hyperview can be used to plot time history files. Energy balance curves are output by default, only need to define TFILE output frequency.
<?xml version="1.0" encoding="UTF-8"?>
Check the following video (relevant from 1:38:30):
2016 Directed Learning Webinar Series - Crash Analysis with RADIOSS - Altair University