🎉Community Raffle - Win $25

An exclusive raffle opportunity for active members like you! Complete your profile, answer questions and get your first accepted badge to enter the raffle.
Join and Win

How to create load vs. displacement plot in Hyperview

User: "pianpianc"
Altair Community Member
Updated by pianpianc

I had found some other people talked about as showed below:

<?xml version="1.0" encoding="UTF-8"?>image.thumb.png.8671a02e5cae72a24e03bfbe0ac1d315.png

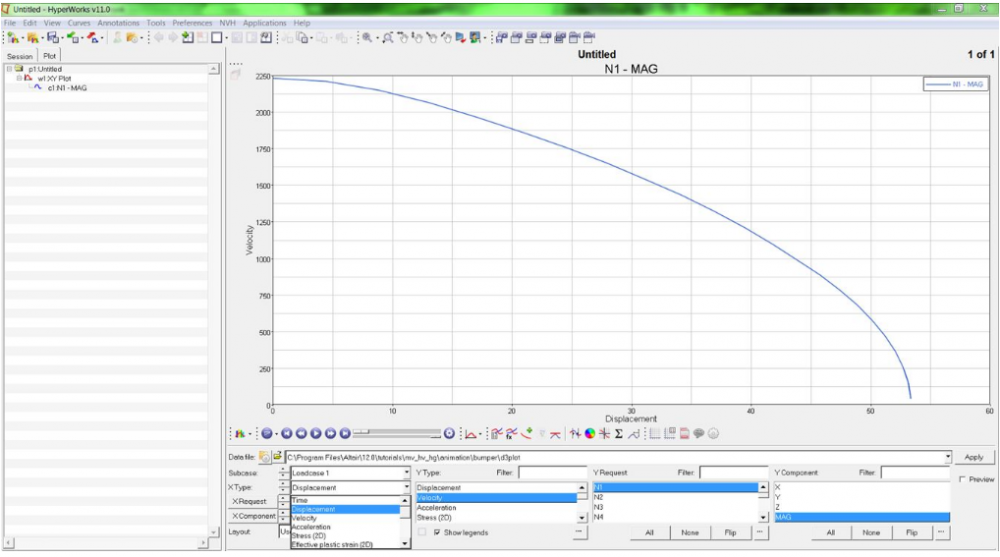
However, I don't know what kind of data file I should be using? Is there a specific type of data I need to output from Hyperview, or from Hypermesh before running the analysis?

Also does anyone know how to plot displacement vs. time as well?

Any help will be very appreciate.

Thank you!

Find more posts tagged with

Sort by:
1 - 1 of 11
    User: "Mario_21478"
    Altair Community Member
    Updated by Mario_21478

    Hello,


    Normally you should output your curves into binouts (otherwise you have only the number of points from d3plot).


    You have to specify which type of output you need, e.g. displacements and forces. Both types are written as function over time (as standard).

    Create two curves over time (displacements, forces) and create a third one with your displacement as X axis and your force as Y axis.

    ->Define Curves->Add->Type Math->Select curves (button)->Change index x (for x=) into y (see picture)


    image.png.605eece3bf77862f0379e28a6e465bbe.png


    Best Regards,

    Mario