Hi All,
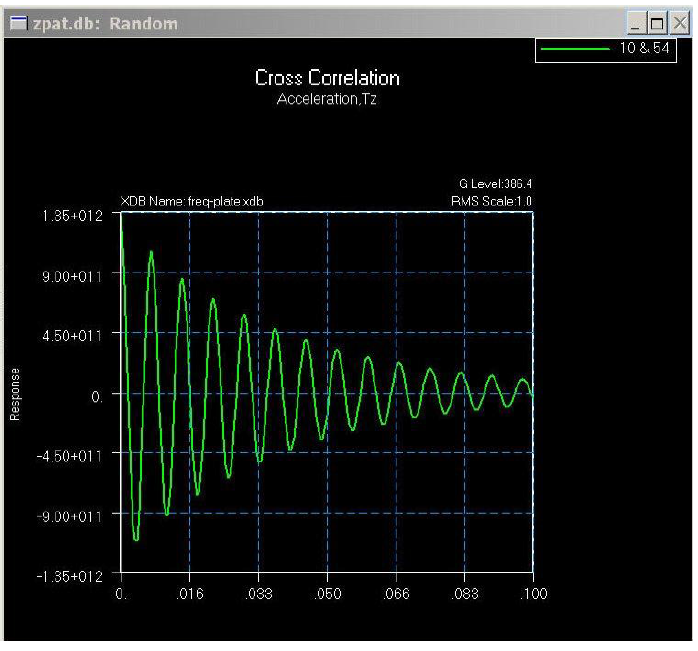
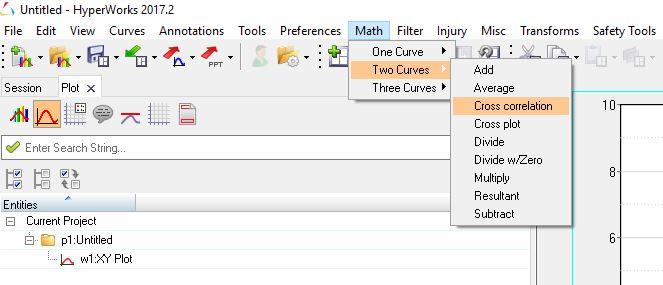
I am performing Random response analysis in Optistruct, How to plot the Cross-Correlation Function between two Nodes ?
I came across this from MSC vibration Manual( shown in the images attached)
<?xml version="1.0" encoding="UTF-8"?>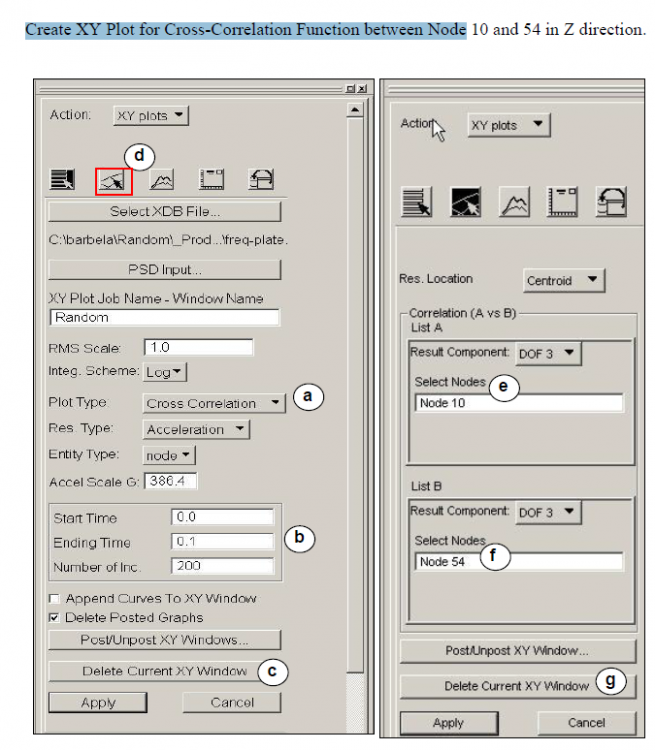
<?xml version="1.0" encoding="UTF-8"?>