I have simulated an array of dipole antennas in FEKO and extracted the polar plot data of the far field radiation pattern in the form of a .dat file. However, when I am plotting the same graph using MATLAB using the extracted data, I am getting a completely different result. I am attaching the images of the plots obtained using FEKO and MATLAB and also the data file extracted from FEKO. How can the polar plots be obtained using MATLAB? Please suggest.
P.S. I have used the following MATLAB command after importing the .dat files (containing data from the FEKO polar plot for radiation pattern): polar(Phideg,FarField)
<?xml version="1.0" encoding="UTF-8"?>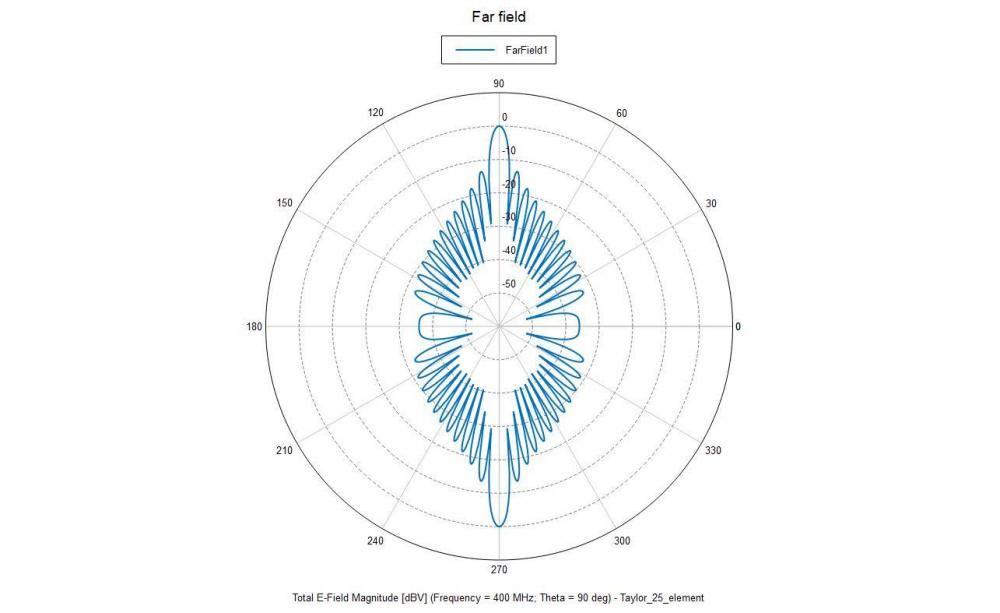
<?xml version="1.0" encoding="UTF-8"?>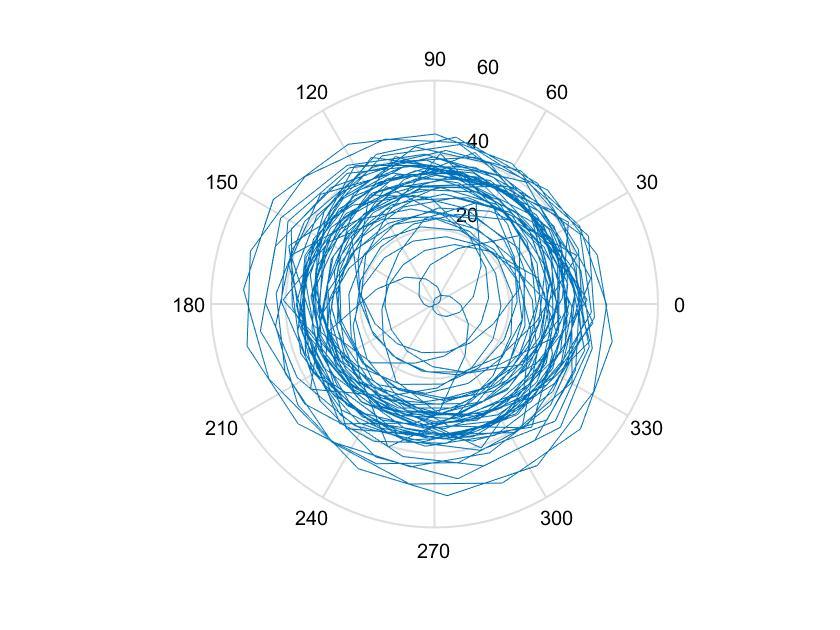
Unable to find an attachment - read this blog
