The Siemens Community Catalyst program was co-created with our community to acknowledge technology leaders who consistently contribute to the Siemens Community. Nominations are accepted on a rolling basis.
Hi,
Any one can advise how to plot and see the convergence curve when running in Simlab Nonlinear/Optimization job?
Thanks.
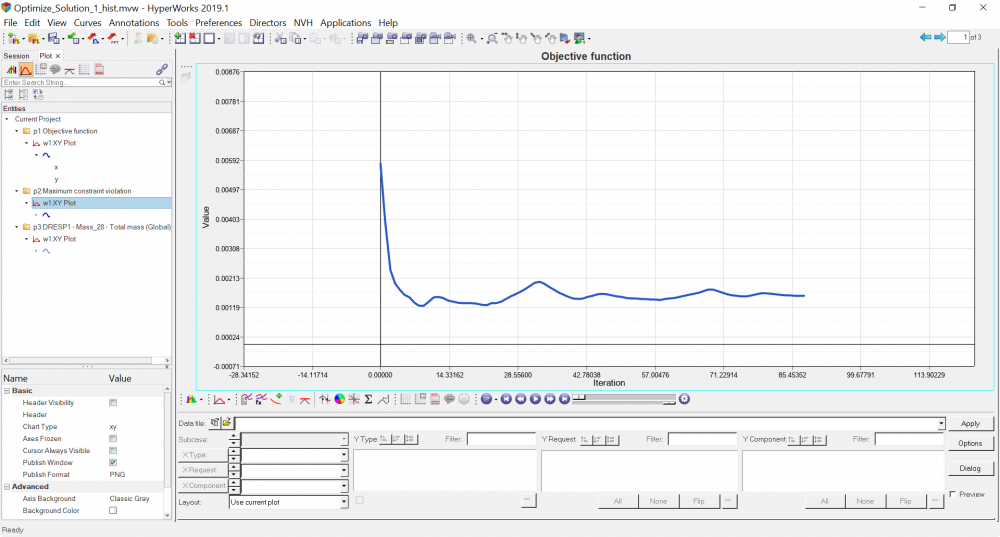
Currently, I often use HV to open hist.mvw to see this.
<?xml version="1.0" encoding="UTF-8"?>
Currently, convergence curve plot is not supported in SimLab. We are working on this. Once it is completed, I will let you know.
Join us for a community conversation on Pulse Width Modulation (PWM), a fundamental technique in electric motor control, and explore how different PWM strategies can yield significantly different results. This webinar provides a comparative analysis of various PWM methods and their effects on motor efficiency, torque…
Join us for a community conversation to discover the Advanced Iterative Solver(AIS) in Simcenter Feko and its application to electrically large and computationally demanding electromagnetic models. The session will provide a general overview of how iterative solution methods can help improve efficiency of large scale…
Join us for a community conversation on how High-Performance Computing (HPC) and Simcenter PSIM work together to meet the increasing demands of modern power electronics simulation. During this one-hour technical session, you'll discover how leveraging HPC can speed up simulations, improve scalability, and empower engineers…