Digitize plots in images

robertavarela
robertavarela New Altair Community Member
edited February 20 in Community Q&A

Hello all,


I wanted to share with you a tool to digitize plots in images using OML and Python. The aim is to convert plots that are introduced in text books like Analysis and Design of Flight Vehicle Structures (Bruhn, 1973):
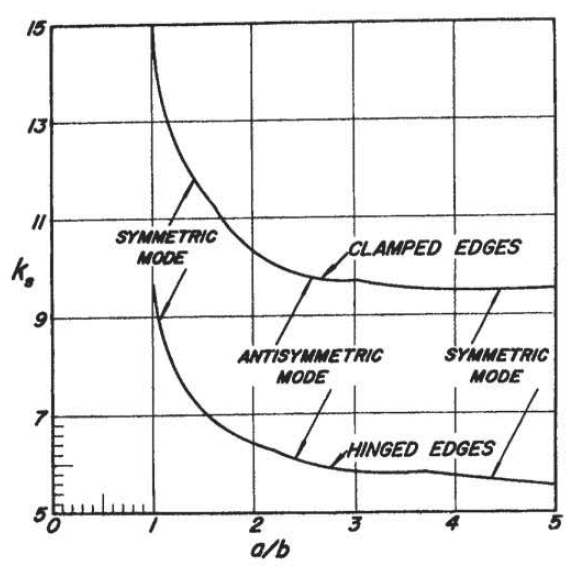
image.png.8f5918137d047fe8caa63a9153e1d80e.png

Such plots are commonly used in industries like Aerospace to calculate constants and other parameters that assess Margins of Safety of components and systems. Finally, we can do a polynomial curve fitting to use these curves and compute these constants without the need to look at the plots everytime they must be applied.


The steps of the attached scripts are:

1) Give the axes bounds, degree of polynomial curve fitting and image whose plot will be digitized

2) Hit Start in the OML script (it will automatically call the Python script)

3) Give a first click with the mouse button to start selecting the corners of the plot

4) Select the corners
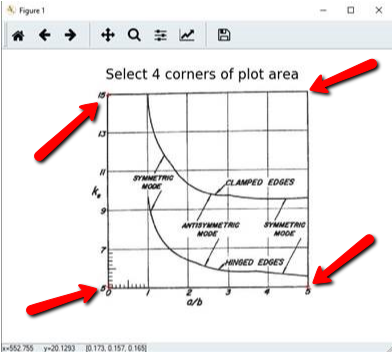
image.png.8290b60b159e8ee834c433b855c31972.png

5) Give another click to select the points

6) Select as many points as you want
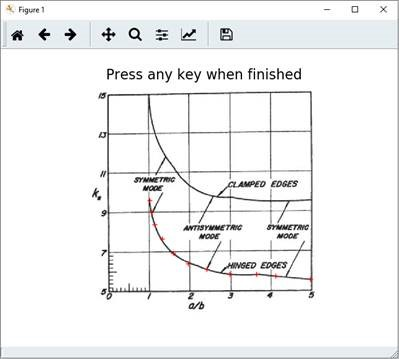
image.png.980a0b7d0bc520255e70bec7ca77ac8b.png

7) Double click with any key to finish the selection

8) Plot is generated and polynomial coefficients are computed and printed
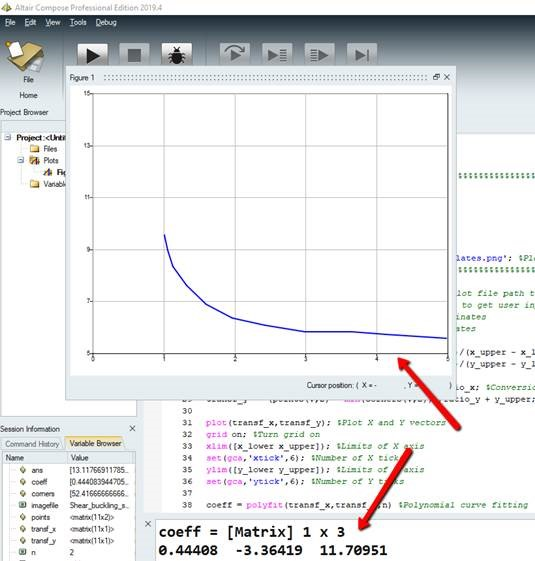
image.png.6c271c1e2558ead61bb730e19536772b.png


Regards,


Roberta


Tagged:

Answers

  • ChristianKehrer
    ChristianKehrer Altair Community Member
    edited June 2020

    This is absolutely awesome, Roberta!

    Thank you for sharing!


    Best

    Christian

  • Adriano_Koga
    Adriano_Koga
    Altair Employee
    edited June 2020

    Really nice! kudos!

  • Andrew Jackson
    Andrew Jackson New Altair Community Member
    edited August 2023

    Hi, I do not seem to see the code anywhere. Can someone point me to it?

  • AltairLiz
    AltairLiz
    Altair Employee
    edited August 2023

    Hi, I do not seem to see the code anywhere. Can someone point me to it?

    Hi Andrew,  the files have been attached.

  • Ralph Weibrecht_21508
    Ralph Weibrecht_21508
    Altair Employee
    edited February 20

    Great,

    so far I understand this tool supports basically to digitze xy-plots like

    - displacement-force curve(characteristic) of an engine mount elastomer
    - or the velocity-force curve(characteristic) of a damper

    xy_plot.png

    image

    meaning 

    - Recognize which characteristic curves are displayed
    - Recognize which units are shown on the axes
    - Recognize which scaling is present
    - Derive the value pairs in order to be able to use the characteristic curve in the simulation

    True ?

    thanks

    Ralph