The Siemens Community Catalyst program was co-created with our community to acknowledge technology leaders who consistently contribute to the Siemens Community. Nominations are accepted on a rolling basis.
Once you plot in a 3D space (for example using surf function)
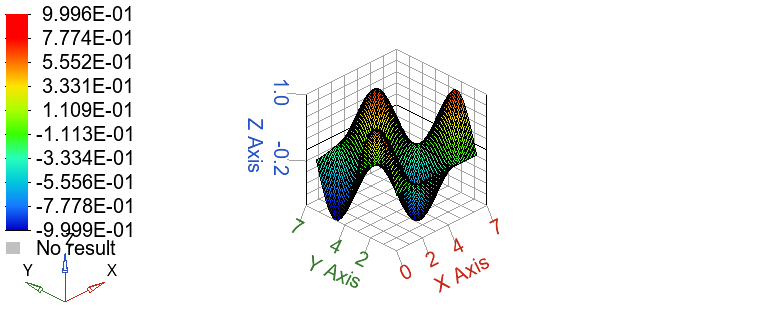
x=[0:0.1:2*pi];
y=x; z=sin(x')*cos(y);
s=surf(x, y, z)
If you add legend() to your script you will add a colorbar, as here shown:
Hi Lorenzo,
Could you please show me a script example (can be the above colorbar)
Thank you
Please, anyone knows how to add a colorbar?
Thank you.
Hi,
check this script!
Cheers,
L
Unable to find an attachment - read this blog
Lorenzo,
Thank you so much for the info.
Do you know as well how I can edit the color, values and scale?
Regards,
Henrique
Hi Henrique,
you can access some properties through get(gca) or get(gcf) and then change them through set(gcf,'propertyname','value') or set(gca,'propertyname','value').
Thanks /emoticons/default_smile.png' srcset='/emoticons/smile@2x.png 2x' title=':)' width='20' />