The Siemens Community Catalyst program was co-created with our community to acknowledge technology leaders who consistently contribute to the Siemens Community. Nominations are accepted on a rolling basis.
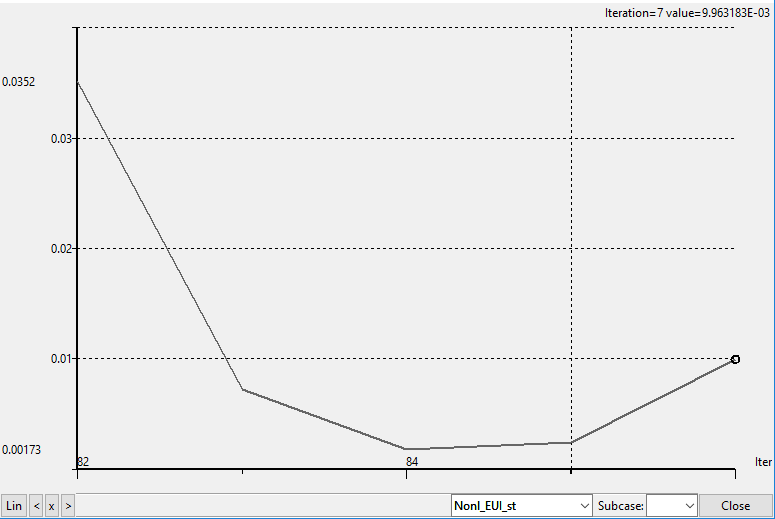
How to read this graph..What is in X-axis and Y-axis.
This is the new feature introduced in version 2017 while the nonlinear analysis job is running, we can plot the progress of convergence. Refer attached pdf from release notes.