How to plot a value of a curve of a certain point

Sotiris
Sotiris New Altair Community Member
edited October 2020 in Community Q&A

Hello,


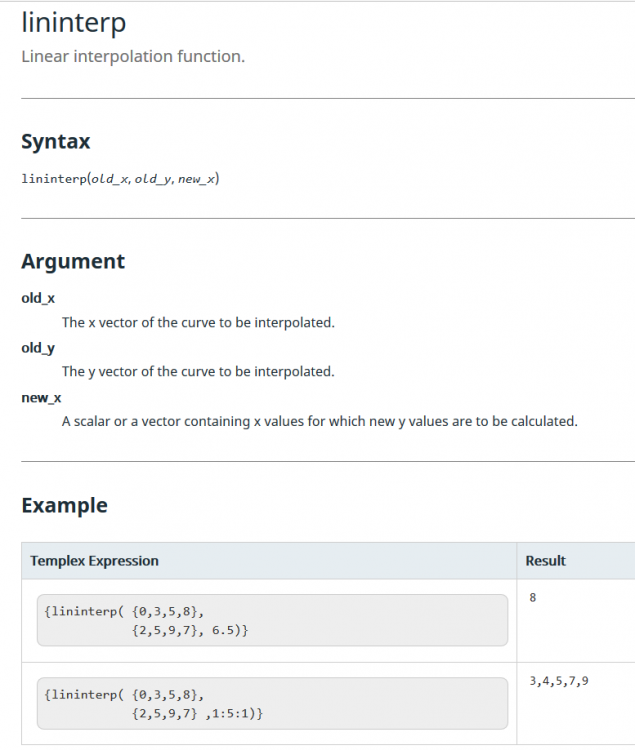
Do you know if it is possible to plot a value of y for a given input value x? To make it little bit more clear… in order to plot the p1w1c1.x,y maximum / minimum value you call max(p1w1c1.y) or min(p1w1c1.y) but if you want to calculate-plot an y value for a given x value? Is it possible?


Thank you in advance

Answers

  • Sebastian_Karp
    Sebastian_Karp
    Altair Employee
    edited April 2020

    A bit late to the show, but you could use following statements:
     

    getvalue will loook for first instance of the given value (here: 40) in X and returns Y of same index.
    To interpolate if value is not exactly found in X, use linear interpolation with lininterp.


    {getval2(p1w1c1.x, p1w1c1.y, 40)}


    {lininterp(p1w1c1.x, p1w1c1.y, 40)}


    <?xml version="1.0" encoding="UTF-8"?>grafik.thumb.png.2d02d2f3aa74cc9fd357896f5df14577.png


    <?xml version="1.0" encoding="UTF-8"?>grafik.thumb.png.c8028954adf6190a7351ee04f0f536d9.png

Welcome!

It looks like you're new here. Sign in or register to get started.

Welcome!

It looks like you're new here. Sign in or register to get started.