The Siemens Community Catalyst program was co-created with our community to acknowledge technology leaders who consistently contribute to the Siemens Community. Nominations are accepted on a rolling basis.
Hi there,
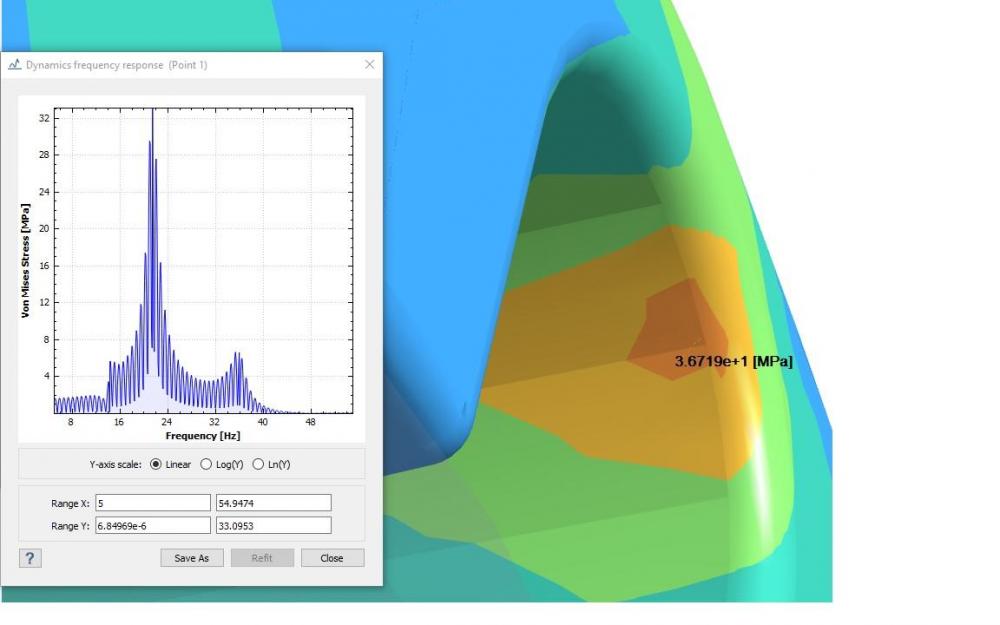
I am reviewing results from a harmonic analysis. Is there an explanation for the results difference between the probe display and the chart ?
The software version is 2019.4.1.63.
Best regards
<?xml version="1.0" encoding="UTF-8"?>
Hi,
It is strange to see the probe stress result (36MPa) beyond the stress range of the chart (33MPa).
Could you please share this SimSolid file?