Hi,
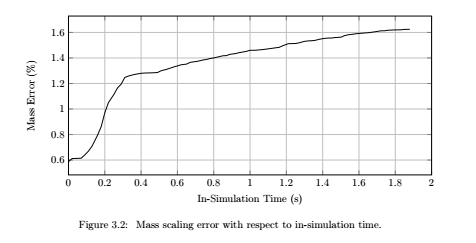
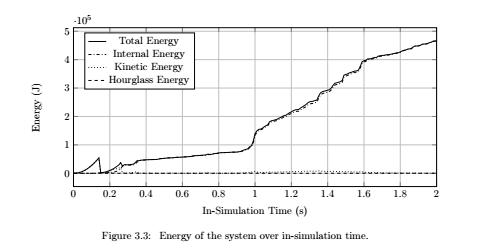
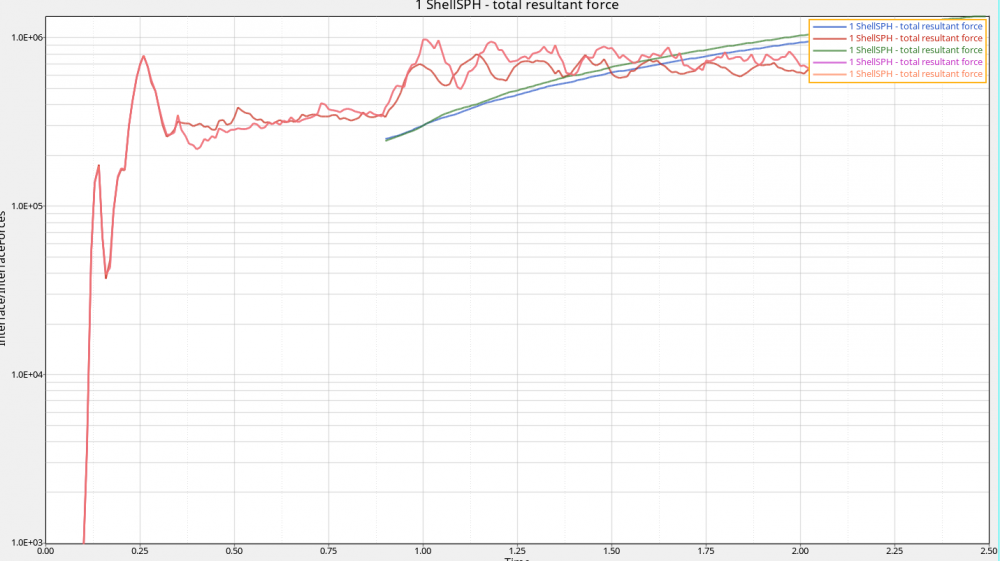
I am trying to interpret my results for a sloshing simulation using interface loads. Unfortunately, I cannot attach all my results due to the size of the model, however I am running it in two parts: One using KEREL and one using AMS. The KEREL is used only to settle the SPH, before the sloshing begins in the AMS portion of the simulation. To my understanding, sloshing simulations should show a single peak for interface forces at the point where slosh is at a peak, however my T01 file has various up and down peaks, while the T02 file shows a linear increase in interace force until the end of the simulation. I am not sure which interface force graph to trust (if either, because it does not seem consistent with reality either way). Furthermore, based on observations in the model stresses, it seems the interface load is on the order of 8e5 only in very specific spots, even though the elements are highly refined. Would appreciate any suggestion.
Thanks in advance.
<?xml version="1.0" encoding="UTF-8"?>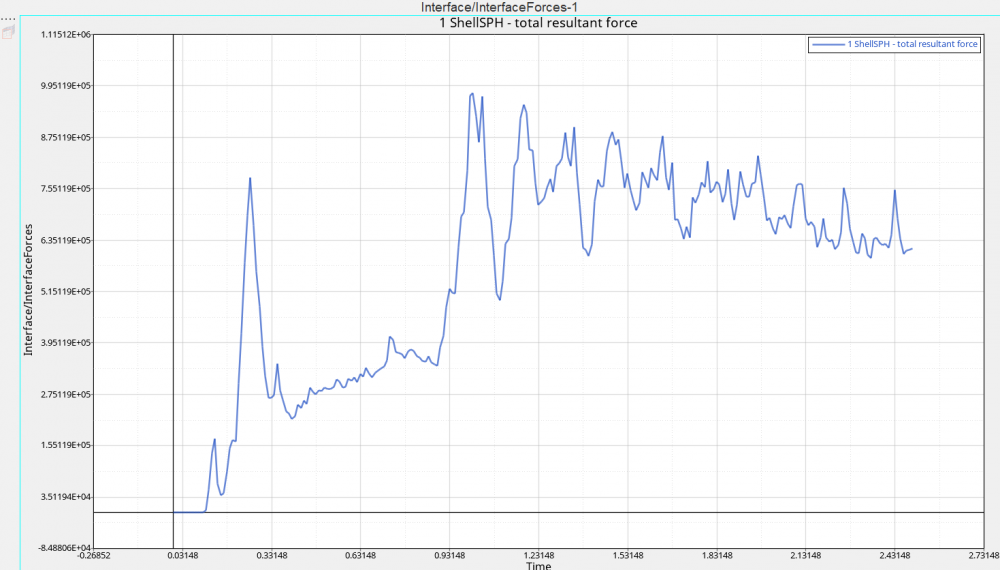
<?xml version="1.0" encoding="UTF-8"?>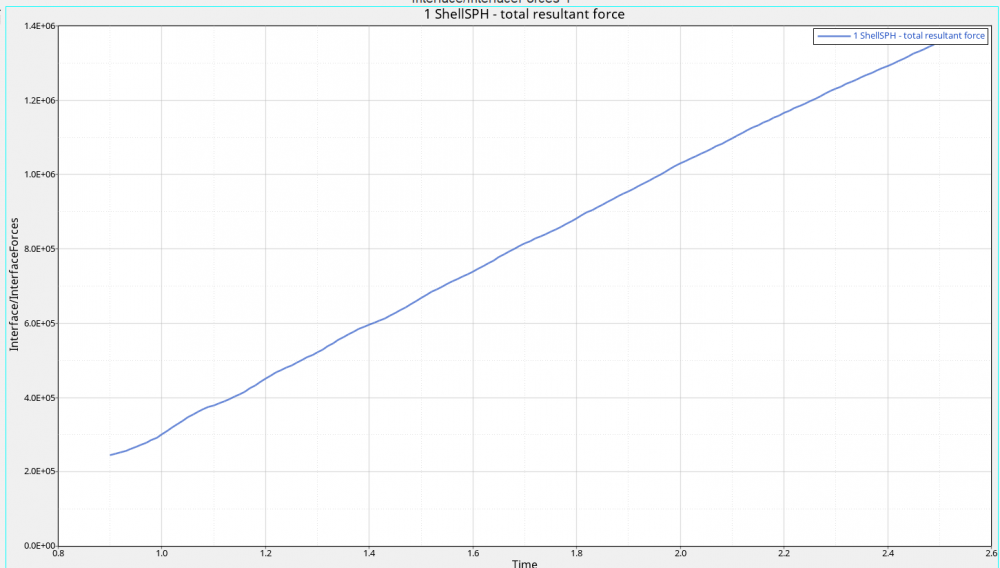
Unable to find an attachment - read this blog