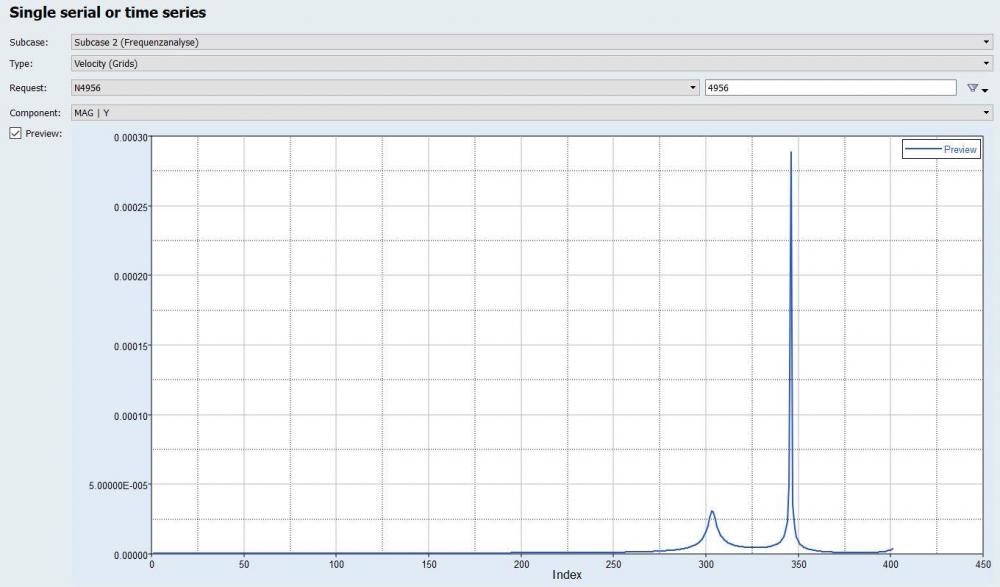
Define Output Response as vector instead of a value (scalar)
Hello together,
is it possible to define and save a result (graph) in the output response window as a vector with all the given points instead of just evaluate one result for a specific point.
For example: I have the given curve as shown in the picture. Now i want to save this curve or graph as a vector or in a similar format. With the tutorials I can only read out one specific value of the curve at one given point. But my aspiration is it to save the whole curve, to display it or use it for a vectorial calculation.
Do you have any advise how i can do this with hyperstudy? Is it possible to do this in the define output response window?
Thanks in advance and cheers
Answers
-
Please refer below post.
https://community.altair.com/community?id=community_question&sys_id=1856c4b61b2bd0908017dc61ec4bcb4f0 -
Rahul Rajan_21763 said:
Please refer below post.
https://community.altair.com/community?id=community_question&sys_id=1856c4b61b2bd0908017dc61ec4bcb4fHi @Rahul R,
The linked post refers to the LINTERP function and HS4200, which both seem to still only deal with one data point being passed to the output response. Do you know if it is possible to perhaps define an output response as an array/vector of values and have it write the data to a .txt file (or another format - I don't need to directly see the values in HyperStudy, but if it's possible that would be fine too and it could then be contained within the .xls/.xlsx report generated at the end)?
For example, I want to be able to manipulate force and displacement data outside of HyperStudy, but the only way to obtain the x-y data points (that I'm currently aware of) is by opening the TH or .h3d file in HyperGraph, plotting the desired values, then using "Coordinate Info" for the curve, and copying the data. This becomes quite tedious as the number of runs increases, since I would need to do it for every curve individually. It would then be ideal, during the "Evaluate" step, for HyperStudy to pull this data automatically.
Though maybe this isn't something that can be done in HyperStudy... perhaps there is a less tedious and time-consuming method in HyperGraph or maybe a script needs to be written to pull the desired data from the TH and .h3d files?
Thank you in advance.
0 -
Autumn said:
Hi @Rahul R,
The linked post refers to the LINTERP function and HS4200, which both seem to still only deal with one data point being passed to the output response. Do you know if it is possible to perhaps define an output response as an array/vector of values and have it write the data to a .txt file (or another format - I don't need to directly see the values in HyperStudy, but if it's possible that would be fine too and it could then be contained within the .xls/.xlsx report generated at the end)?
For example, I want to be able to manipulate force and displacement data outside of HyperStudy, but the only way to obtain the x-y data points (that I'm currently aware of) is by opening the TH or .h3d file in HyperGraph, plotting the desired values, then using "Coordinate Info" for the curve, and copying the data. This becomes quite tedious as the number of runs increases, since I would need to do it for every curve individually. It would then be ideal, during the "Evaluate" step, for HyperStudy to pull this data automatically.
Though maybe this isn't something that can be done in HyperStudy... perhaps there is a less tedious and time-consuming method in HyperGraph or maybe a script needs to be written to pull the desired data from the TH and .h3d files?
Thank you in advance.
can you detail what kind of operations you want to perform outside HSt?
You can use Altair Compose to do these operations quite easily and register your own function there, as part of the default functions for HyperWorks. By doing that you enable a whole bunch of powerful tools and also being able to load your TH and H3D data very easily.
But again, it depends on your needs. HyperStudy has access to your results data and sometimes it is just a matter of using the templex equations for getting what you need.
Registering a Compose function to be used later by HyperStudy:
0 -
Adriano A. Koga_21884 said:
can you detail what kind of operations you want to perform outside HSt?
You can use Altair Compose to do these operations quite easily and register your own function there, as part of the default functions for HyperWorks. By doing that you enable a whole bunch of powerful tools and also being able to load your TH and H3D data very easily.
But again, it depends on your needs. HyperStudy has access to your results data and sometimes it is just a matter of using the templex equations for getting what you need.
Registering a Compose function to be used later by HyperStudy:
Hi @Adriano A. Koga,
I am looking to be able to manipulate the data (multiplication/division by a scalar, multiplication/division by other curves, integration of curves) outside of HyperStudy - I know it is possible in HyperGraph, but it becomes quite tedious and time-consuming when there are many TH/.h3d files from multiple runs.
I'll take a look into Altair Compose... I don't see anything for a reference guide or tutorials within Compose, do you know if there is anything like that? I've never used it nor OML before...
Thank you for your response.
0 -
Autumn said:
Hi @Adriano A. Koga,
I am looking to be able to manipulate the data (multiplication/division by a scalar, multiplication/division by other curves, integration of curves) outside of HyperStudy - I know it is possible in HyperGraph, but it becomes quite tedious and time-consuming when there are many TH/.h3d files from multiple runs.
I'll take a look into Altair Compose... I don't see anything for a reference guide or tutorials within Compose, do you know if there is anything like that? I've never used it nor OML before...
Thank you for your response.
There is this topic here, that might be useful:
https://community.altair.com/community?id=community_question&sys_id=cc664cf61b2bd0908017dc61ec4bcb5e
Altair Compose has a sintax very similar to other math tools, such as Octave, Matlab. So if you know one of these, you will have no problem using it.
Besides the easy sintax, you can easily read CAE data from your most used FE codes and manipulate data using it.
Attached you will find 2 pdfs extracted from the Compose docs. these might help you.
In general, Compose opens a whole new world of options for HyperStudy.
1 -
Hello everyone,
I'm writing below this post because It's still an open issue, Imo. Is it possible there's no way to output array data in HyperStudy without going through other software? I mean, in the "Data Sources" panel HS reads the output files and shows a preview of the curves, but when you move to the "Define Output Responses" panel, you're supposed to define arrays only. This is a limitation if you want to export vectors/curves/arrays via the "Generate Spreadsheet Report" in HyperStudy, for instance.
Is an HS's limitation, or is there a way to do this? @Rahul R @Adriano A. Koga
0