force vs displacement graph
Hi,
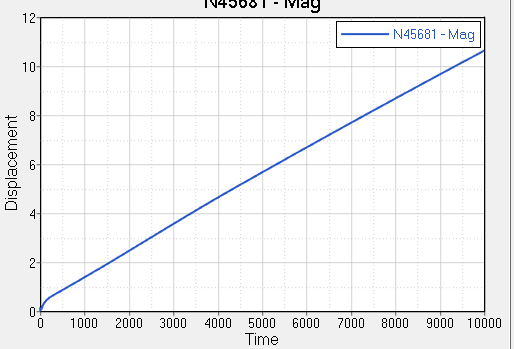
How to plot graph displacement vs force? I want to plot displacement vs force graph but no force parameter in my result. As below is the graph i get from the hyperview result. I hope anyone can help me since i'm not familiar with this software. thank you./emoticons/default_smile.png' srcset='/emoticons/smile@2x.png 2x' title=':)' width='20' />
Answers
-
Please try with cross plot option in HyperGraph.Refer cross plot pdf from below post.
0 -
Thank you for your reply Mr Rahul /emoticons/default_smile.png' srcset='/emoticons/smile@2x.png 2x' title=':)' width='20' />, another question is, what is the value that i can put on Tstop on engine file? is it follow the maximum y value in graph? or any idea?
Thank you.
0 -
Video guide for Basic Questions on RADIOSS – YouTube
You can also post Radioss specific queries in Radioss Forum.
http://forum.altairhyperworks.com/index.php?/forum/34-radioss/
0 -
Alright..thank you Mr Rahul/emoticons/default_smile.png' srcset='/emoticons/smile@2x.png 2x' title=':)' width='20' />
0 -
Hi,
The Tstop is the total run time. For explicit analysis normally the run will last for milliseconds only. So we have to provide the same total run time the user wish to run an analysis here in Tstop.
In the curve for the load defined the X is the time in which we ramp the load on to the model.
For /CLOAD suppose the curve is X Y (time is in milliseconds and force in N),
0 0
.3 50
This means over a time of 300 milliseconds we are applying a load of 50N over the nodes selected, that is ramping the load gradually over the time period.
And we will run the model to 0.3 seconds, that is Tstop we will define 0.3.
Also, please go through https://altairuniversity.com/learning-library/7-guidelines-to-apply-quasi-static-load-in-explicit-simulation/ which provides basic guidelines on applying a quasi static load for explicit analysis.
Hope this clears your doubt. If you still have questions, please write to us, we are happy to help.
0 -
thank you so much Mr George/emoticons/default_smile.png' srcset='/emoticons/smile@2x.png 2x' title=':)' width='20' />
0 -
Hi Mr George..
when i reviewed back you explanation, i'm getting confused. why you put 0.3s instead of 300ms in load time curve since i used ms unit in time? is it means that CLOAD curve already set in seconds? thats why you put 0.3s? then in Tstop i also have to define 0.3s instead of 300ms?
thank you.
0 -
Hi,
Sorry for the confusion. I was following Tonnes,mm and seconds and has put 0.3. Please follow the unit system you are following, that is if milli seconds then it will be 300.
0 -
okayyy..thank you so much Mr George...clear crystals/emoticons/default_smile.png' srcset='/emoticons/smile@2x.png 2x' title=':)' width='20' />
0