load body/define curve

Altair Forum User
Altair Forum User
Altair Employee
edited October 2020 in Community Q&A

good day..


im running an analysis which involve gravity loading/body load.


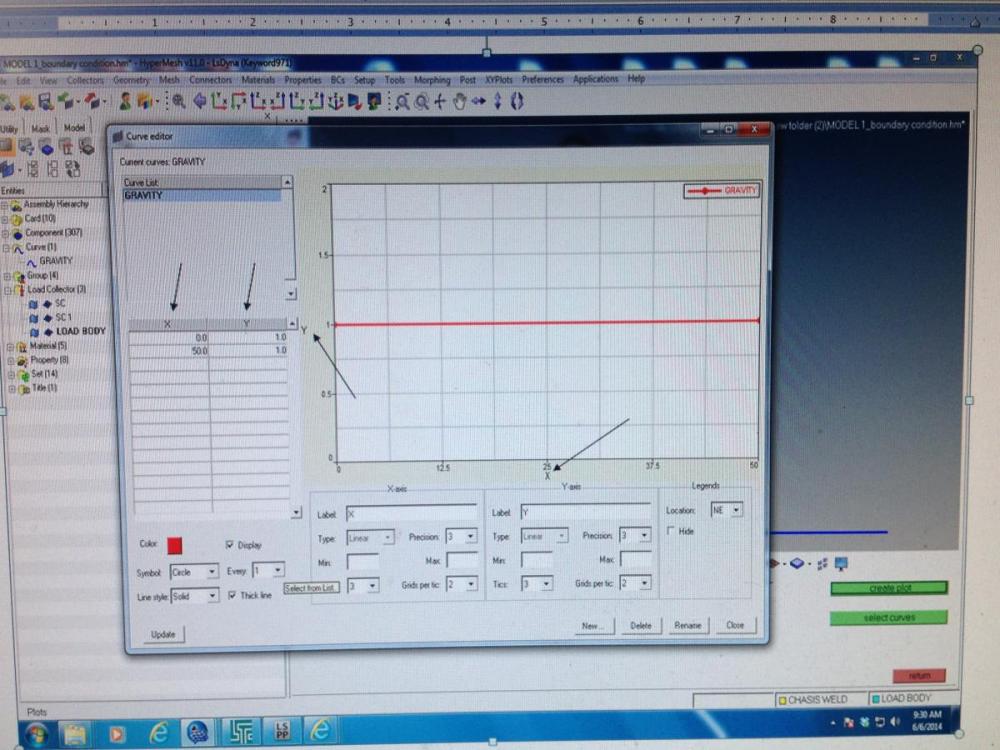
but I not sure what to input the value of X and Y at the curve editor and what the relation these curve with the gravity effect to the analysis....thumbnail attached..  


can anyone explain how to use it and how to input the value...


thank a lots..


<?xml version="1.0" encoding="UTF-8"?>post-31814-0-95814600-1402020366_thumb.j
Tagged:

Answers

  • Altair Forum User
    Altair Forum User
    Altair Employee
    edited June 2014

    Hi,


    X component defines the time and Y component defines the magnitude of the load.

  • Altair Forum User
    Altair Forum User
    Altair Employee
    edited June 2014

    Thank prakash for reply.. But i little bit confuse how can i set the time and load..?? I already set the gravity acc. as 9810... then what time and load must i put on that graph..??

  • Altair Forum User
    Altair Forum User
    Altair Employee
    edited June 2014

    The way you put on the graph is right. You deifne the vector and magnitude in BCs and define the function.


    <?xml version="1.0" encoding="UTF-8"?>post-7616-0-13320100-1402030789_thumb.jp

  • Altair Forum User
    Altair Forum User
    Altair Employee
    edited June 2014

    Prakash value 10000 you put on the table meaning is 10000s.?? And 1 meaning 1N..??

  • Altair Forum User
    Altair Forum User
    Altair Employee
    edited June 2014

    it all depends on what units you are using for your model. HyperMesh is unitless. 


    Please maintain unit consistency.

  • Altair Forum User
    Altair Forum User
    Altair Employee
    edited September 2017

    How to give a function in curve editor. like e*x or some complex function.

    I have some result which i get from some experiment how to input it in system ?


  • Altair Forum User
    Altair Forum User
    Altair Employee
    edited November 2020

    Hi,

    Try with XY Plots option in the tool bar. Use the Edit Curves panel to create new curves or edit existing ones. Each vector can be defined using either a data file or a math expression.

    Please go through the attached document which explains the same.

    Unable to find an attachment - read this blog

  • rea2
    rea2 Altair Community Member
    edited August 2018

    Thank you so much, that worked!