The Siemens Community Catalyst program was co-created with our community to acknowledge technology leaders who consistently contribute to the Siemens Community. Nominations are accepted on a rolling basis.
Hi,
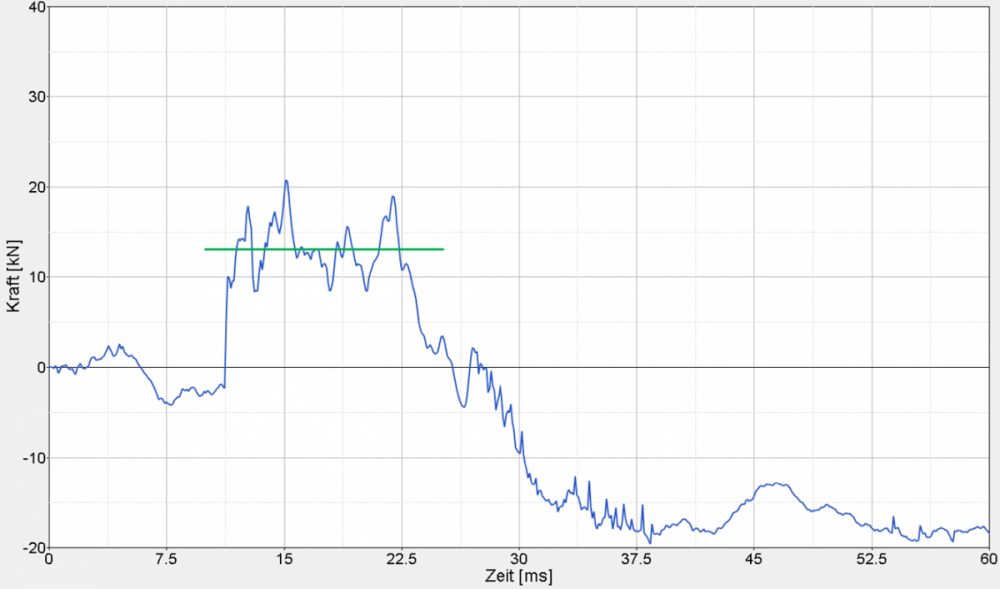
i want to include an average level line on specific sections of curves in my plot window, like in the attached Image.
Is there some funtion / plot macro to do this?
<?xml version="1.0" encoding="UTF-8"?>
You can use 'Datum Lines' option under the 'Curve' tab.
Hope it helps.
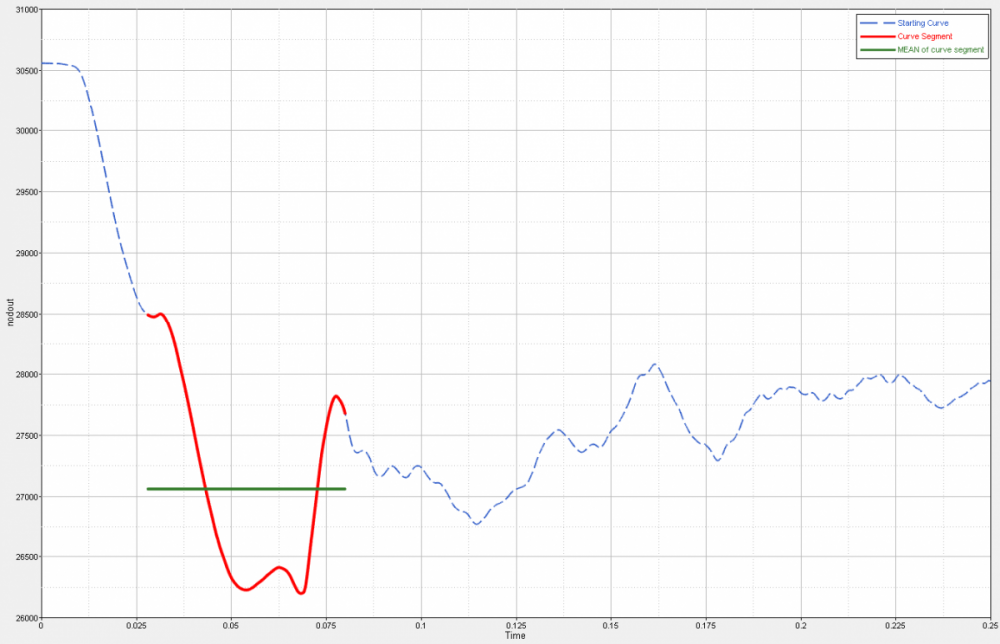
Please try the following:
1. use 'plot macro' button to switch to macros
2. search for 'subrange x'
3. input your curve (double click on 'curve' and select)
4. input 'X start' and 'X end' for your range of interest
5. press apply -> new curve is created
6. search for macro 'mean - curve output'
7. select the new curve (double click on 'curve' and select)
8. press apply ---> be happy
If you have installed MVP-Toolbar, then both functions are included in the menus Curve Manipulation-> Curve Cut and Statistics->Meanvalue.
Best regards,
Mario
Thanks Mario, this is what i was looking for..