Hello,
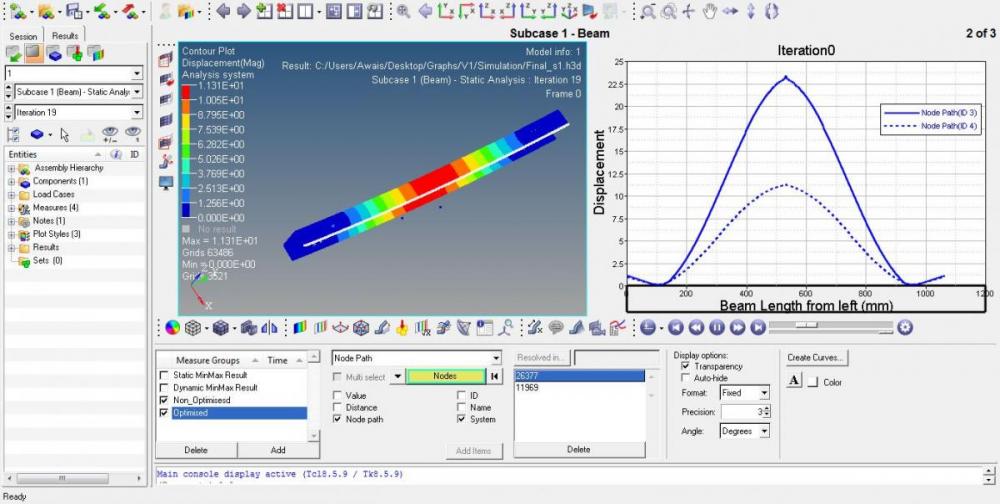
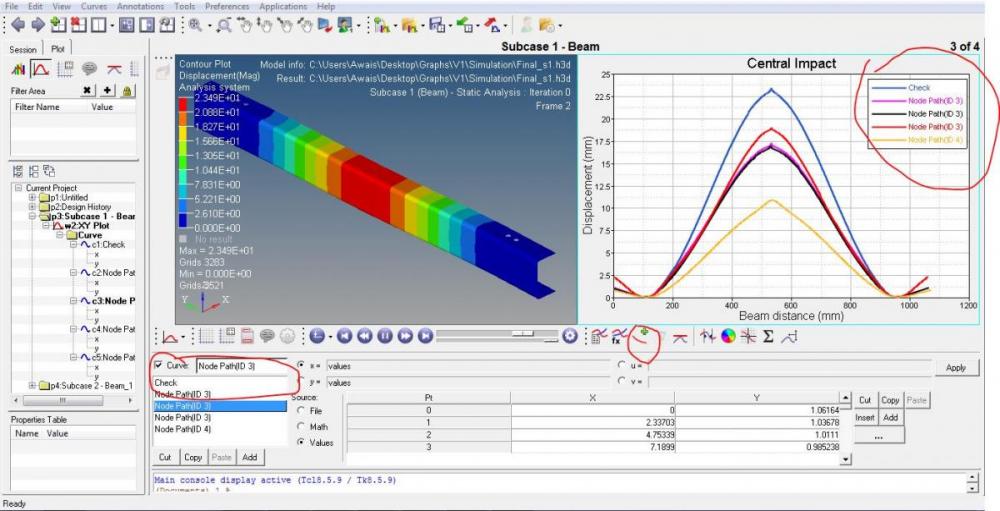
I have conducted a topology optimisation on several bumper beam models (attached) and would like to plot the curves for displacement and stresses variations across the length of the beam on the same graph.
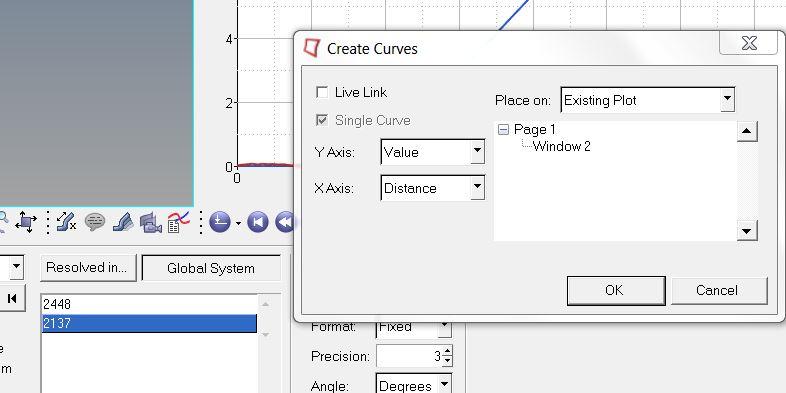
I have managed to plot the the displacements before and after optimisation of one of the beams beam, however I was wondering if I can do this for multiple models on the same graph. Also, I want to change the name of the legends and can not find how to do that.
I have tried to plot them in hyperview and hypergraph but could not work it out. Can anyone please guide me through this ?
Thanks
Regards,
Awais
<?xml version="1.0" encoding="UTF-8"?>