Hello, i am currently using Motion View to simulate a suspension geometry and I performed a Kinematics and compliance Analysis. But the standard analysis reports are not enough for my analysis.
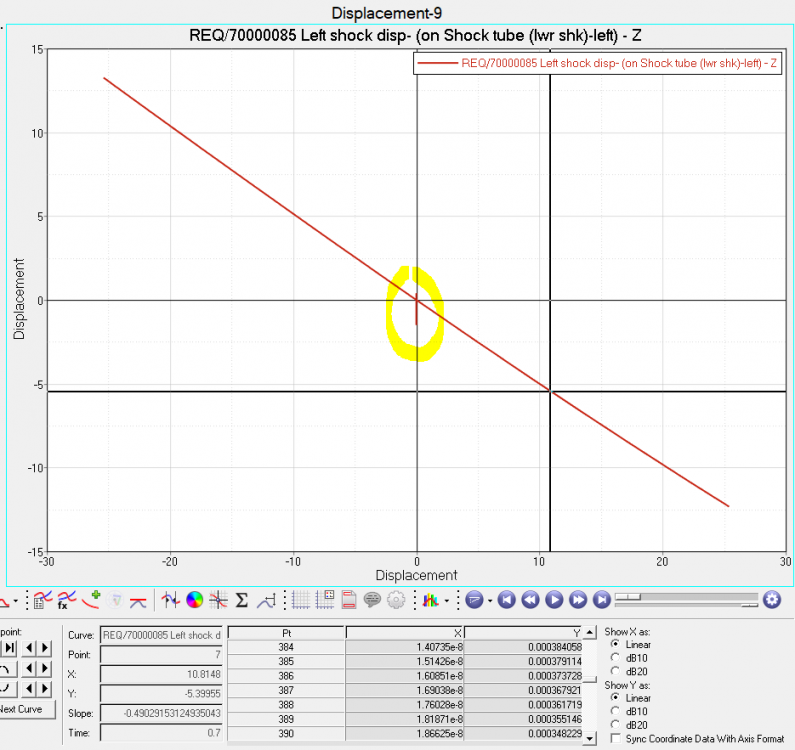
For example I want to plot the displacement of the spring or shock vs wheel center displacement, but when I do so the entire date of the analysis is plotted and I get these values on this yellow area.
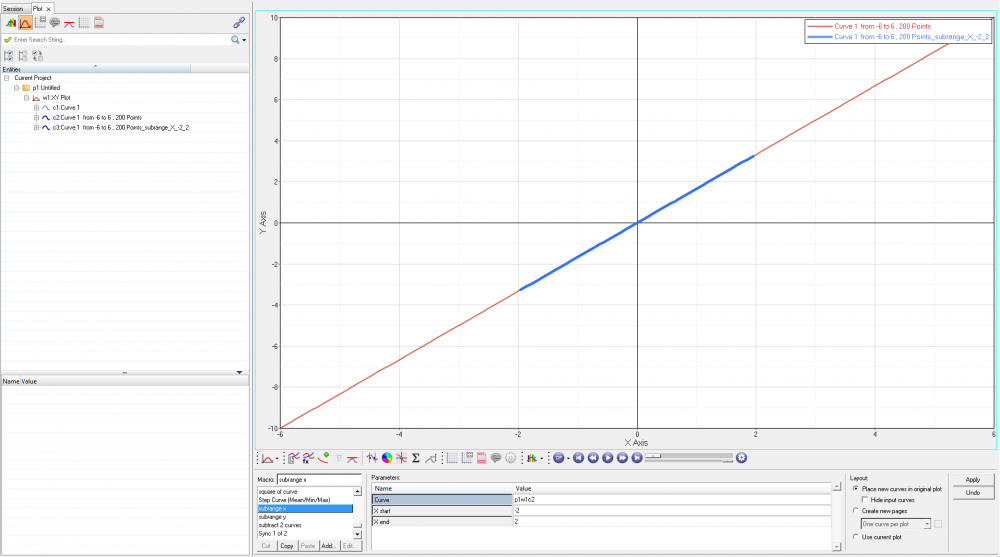
What I want to know is how to select certain part of the analysis to plot. For example only the part where the ride analysis is performed or the steering analysis is performed. Because the standard reports, only plot a certain range of data generated from the ptl file.
I am using the templates provided by Altair of Formula SAE suspension to build the models and perform the analysis.
I also want to know if there is a list that relate the requests and components that are generated from the user defined outputs, because I would like to know if the Roll center height is one of this variables. So I don´t have to create it.
<?xml version="1.0" encoding="UTF-8"?>