Run time and load application time

User: "Altair Forum User"
Altair Employee
Updated by Altair Forum User

Hi, 

I have query regarding analysis run time and load application time(loading condition).

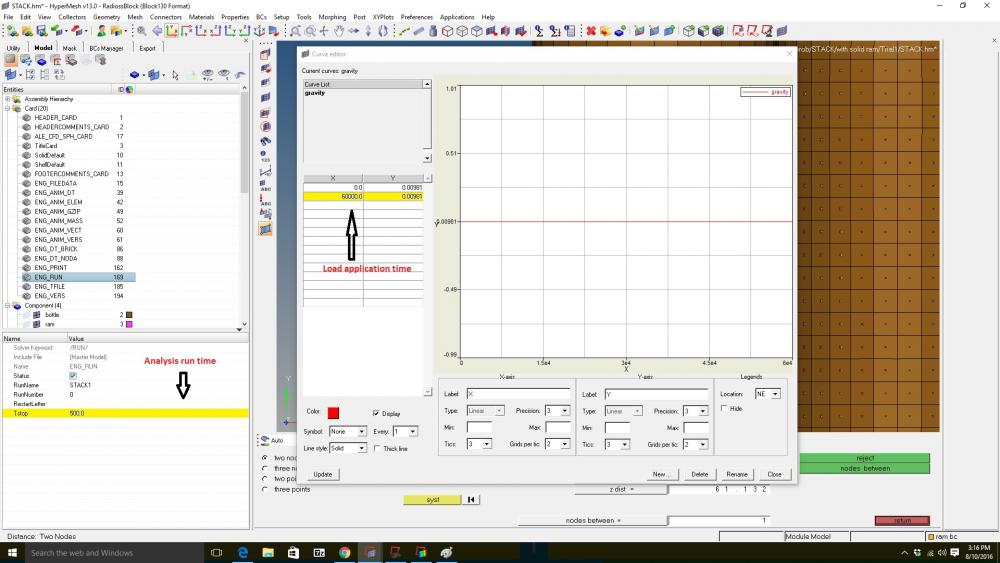
Is it necessary that analysis run time and load application time should be same?

Herewith sending the a .jpg file for reference whereas run time is 500 millisecond and load application time in curve is 60000 millisecond.

Kindly suggest the solution.

Thank you.<?xml version="1.0" encoding="UTF-8"?>run time.jpg

Find more posts tagged with

Sort by:
1 - 11 of 111
    User: "Rahul Rajan_21763"
    New Altair Community Member
    Updated by Rahul Rajan_21763

    Refer below link from our Radioss Ebook on Radioss file structure where we talk about Run time termination for impact & quasi static analysis.Its a 13 minute video after 5th minute you would find important parameter for Analysis.

    https://altair-2.wistia.com/medias/9v47veeusj

    User: "Altair Forum User"
    Altair Employee
    OP
    Updated by Altair Forum User

    Thanks very much Rahul R.

    Now I have cleared about run time.

    Will you tell me that what exactly energy balance in impact analysis?

    Is there any video for energy balance??


    User: "Rahul Rajan_21763"
    New Altair Community Member
    Updated by Rahul Rajan_21763

    Refer below post.


    User: "Altair Forum User"
    Altair Employee
    OP
    Updated by Altair Forum User

    Hi Tushar,

    The energy balance graph is plotted from the T01 file.
    The physics of impact involves conservation of energy and momentum. When a moving object strikes a structure the force which decelerates the mass satisfies conservation of momentum.


    If the energy is initially set in the model:

    • Translational Total Energy (TTE) should be constant or slightly decreasing (loss of energy)

    • TTE = IE + KE + RKE + CE + HE

    • If energy absorption is the goal then most of the kinematic energy should be transformed to internal energy.

    (IE- Internal Energy, KE- Kinetic Energy, RKE-Rotational KE, CE-Contact Energy, HE- Hourglass Energy)


    The major points evaluated during post processing of an analysis can be viewed here: http://www.altairuniversity.com/wp-content/uploads/2012/08/WS8_Nov_2007.pdf

    Please refer this case study also : http://altairatc.com/india/previous-events/2013/images/presentations/RNL-09_Frontal_Crash_SMLISUZU.pdf


    User: "Altair Forum User"
    Altair Employee
    OP
    Updated by Altair Forum User

    Hi,

    Is it necessary the energy curve should like figure1(attached)???

    I run the some of analysis having different energy curve shown in figure.

    Kindly clarify the same.

    Thanking-You.

    <?xml version="1.0" encoding="UTF-8"?>enegy balance1.png

    <?xml version="1.0" encoding="UTF-8"?>enegy balance2.png

    <?xml version="1.0" encoding="UTF-8"?>enegy balance3.png

    User: "Altair Forum User"
    Altair Employee
    OP
    Updated by Altair Forum User

    Hi Thushar,

    These are typical impact (fig 1) and quasi static simulation curves. Based on the loading conditions and nature of analysis, the energy graphs will vary.


    User: "Altair Forum User"
    Altair Employee
    OP
    Updated by Altair Forum User

    Thanks very much for suggesting.

    But how could I predict that my run is completed after observing the energy balance?

    User: "Rahul Rajan_21763"
    New Altair Community Member
    Updated by Rahul Rajan_21763

    Whenever you have initial velocity as loading then its is the case of crash or Impact analysis.Then Figure 1 is the expected curve for such case.


    I think in your case you have only gravity loading?

    User: "gopal_rathore"
    Altair Community Member
    Updated by gopal_rathore

    Hi,

    Yes, it seems a drop test like scenario where after first hit, the object is bounding back and then again hitting and then again bouncing back.

    User: "Altair Forum User"
    Altair Employee
    OP
    Updated by Altair Forum User

    Hi Tushar,

    Observe your energy graph and from a point the system will be stable. That is, from that point the graphs will not have any fluctuations. In your Fig 1, it is clear that the system is stable from 0.025 seconds.  This is how you will conclude that you have ran the simulation for an ideal time.

    As suggested by Rahul and Gopal your third plot is for a drop test case. These are some of the typical simulation curves we observe frequently.
     

    User: "Altair Forum User"
    Altair Employee
    OP
    Updated by Altair Forum User

    Hi,

    Thanks all of you for support.

    Now, I am cleared about the energy balance.