A program to recognize and reward our most engaged community members
Hello
I am a beginner at solidthinking COMPOSE. I just want to know how to plot the following function. I have written the code, but it shows the error. Also, would be great if someone can show me the command for 3D plot
sigma_inf=100; a=10; r=10; theta=[0:0:pi/2]; sigma_rr = @(theta)((sigma_inf/2)*(1-(a/r)^2))+(sigma_inf/2)*(1-4*(a/r)^2+3*(a/r)^4)*cos(2*theta); sigma_theta =@(theta)((sigma_inf/2)*(1+(a/r)^2))-(sigma_inf/2)*(1+3*(a/r)^4)*cos(2*theta);
plot(theta,sigma_rr);
Thanks in advance
Hi Novak,
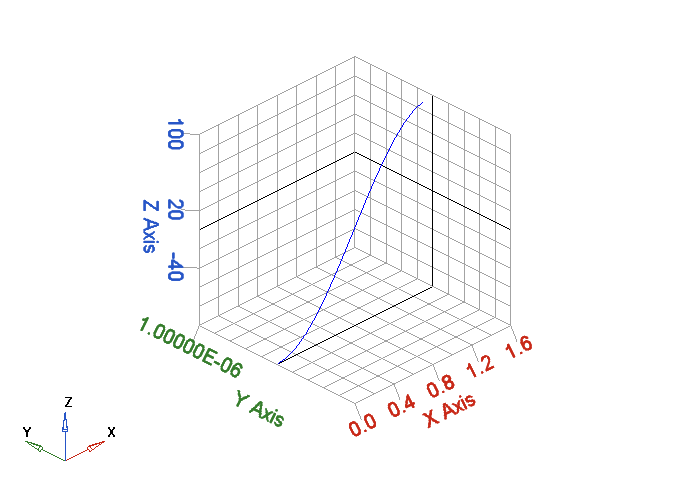
I have made some changes in the code and it works fine for me. The 3-D plot is attached with this reply. The updated code is given below. The errors you made is also mentioned here.
1) Syntax theta=[0:0:pi/2]; is wrong
2) There is no need to mention @(theta) in Line no.5 and Line.no.6.
3) Use plot3 for obtaining 3-D plot.
Thanks
Sijo George
%%-----Updated Code
sigma_inf=100; a=10; r=10; theta=[0:0.1:pi/2]; sigma_rr = (((sigma_inf/2)*(1-(a/r)^2))+(sigma_inf/2)*(1-4*(a/r)^2+3*(a/r)^4))*cos(2*theta); sigma_theta =(((sigma_inf/2)*(1+(a/r)^2))-(sigma_inf/2)*(1+3*(a/r)^4))*cos(2*theta); plot3(theta,sigma_rr,sigma_theta);
<?xml version="1.0" encoding="UTF-8"?>
Thanks a lot george
Just one more question
What if I want to make sigma_rr as a function of 'theta' and 'r' and I want 'r' to go from 10 to 100
shouldn't this work?
sigma_inf=100; a=10; theta=[0:0.1:pi/2]; r=[0:10:100]; sigma_rr = (((sigma_inf/2)*(1-(a/r)^2))+(sigma_inf/2)*(1-4*(a/r)^2+3*(a/r)^4))*cos(2*theta); sigma_theta =(((sigma_inf/2)*(1+(a/r)^2))-(sigma_inf/2)*(1+3*(a/r)^4))*cos(2*theta); plot3(theta,r,sigma_rr,sigma_theta);
just to clarify i want to plot just 'sigma_rr' as a function of 'theta' and 'r'. So i tried removing the 'sigma_theta' from the last line but it still shows error
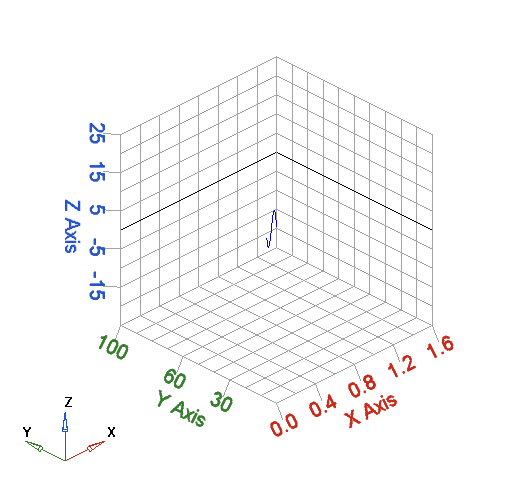
The following code works for me. I made the following changes.
1) Used for loop
2) Removed sigma_theta from the last line. This is because plot3 command accepts only three inputs.
3) Used linspace command to include the radius range.
%%%%----Updated code
sigma_inf=100; a=10; theta=[0:0.1:pi/2]; r = linspace(0,100,16);
for i = 1:length(r) sigma_rr = (((sigma_inf/2)*(1-(a/r(i))^2))+(sigma_inf/2)*(1-4*(a/(i))^2+3*(a/r(i))^4))*cos(2*theta); end for i = 1:length(r) sigma_theta =(((sigma_inf/2)*(1+(a/r(i))^2))-(sigma_inf/2)*(1+3*(a/r(i))^4))*cos(2*theta); end plot3(theta,r,sigma_rr);
Thanks George
But why did you write 16 in the following line and why do we need to specify 0 at the beginning
r = linspace(0,100,16);
If i want to go from 10 to 100, then shouldn' it just be: r = linspace(10,100);
It is because theta has only 16 elements. All variables must have equal number of elements. If you change the number of elements in theta, you must make the corresponding changes in 'r' also. Otherwise plotting and other operations will not take place.
AHh got it
Thanks a lot
Hi
I have couple more questions. For the following, again there is an error. I am assuming it is again something to do with number of elements in theta but not sure how to resolve it. I do want to plot2D between 'sigma_theta' and 'r' and 'r' must go from 10 to 100.
Secondly, how to do I label the axes in this case. If i want to call X-axis 'r' and Y-axis 'sigma_theta'
sigma_inf=100; a=10; theta=pi/2; r=[0:10:100]; sigma_rr = (((sigma_inf/2)*(1-(a/r)^2))+(sigma_inf/2)*(1-4*(a/r)^2+3*(a/r)^4))*cos(2*theta); sigma_theta =(((sigma_inf/2)*(1+(a/r)^2))-(sigma_inf/2)*(1+3*(a/r)^4))*cos(2*theta); plot(r,sigma_theta);
I did figure out the labeling. Please answer just the first question
Hi,
Use the following code for the problem you have mentioned above.
%%------Code-----------------
sigma_inf=100; a=10; theta=pi/2; r=[0:10:100]; for i = 1:length(r) sigma_rr(i) = (((sigma_inf/2)*(1-(a/r(i))^2))+(sigma_inf/2)*(1-4*(a/r(i))^2+3*(a/r(i))^4))*cos(2*theta); end for i = 1:length(r) sigma_theta(i) =(((sigma_inf/2)*(1+(a/r(i))^2))-(sigma_inf/2)*(1+3*(a/r(i))^4))*cos(2*theta); end plot(r,sigma_theta); xlabel('Radius(m)'); ylabel('Sigma_Theta')
Thanks a lot George