Dear all,
I'm working with HyperGraph 2017.2 on a Windows 10 desktop PC. I would like to plot a curve in Hypergraph and color the shaded area under the line.
Via Google I have found this link, where it seems that there is a check box available from the Curve attributes panel on the Line attributes tab.
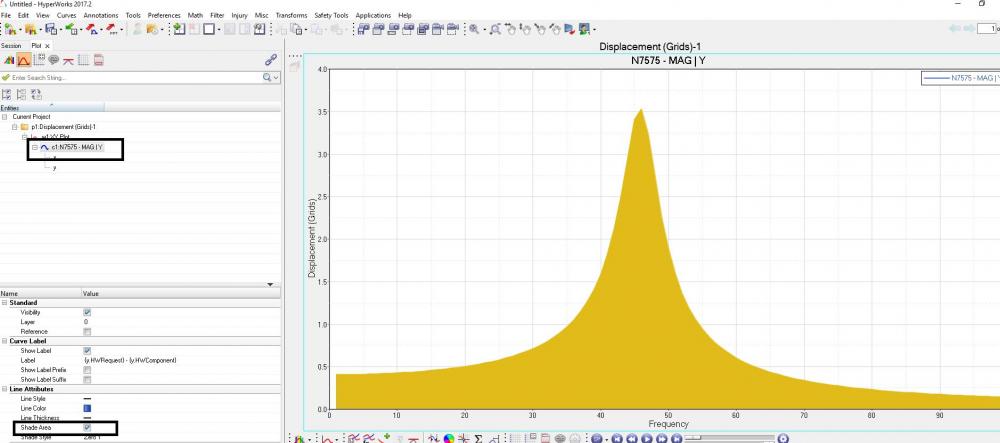
However, this check box seems to be missing for my Hypergraph:
<?xml version="1.0" encoding="UTF-8"?>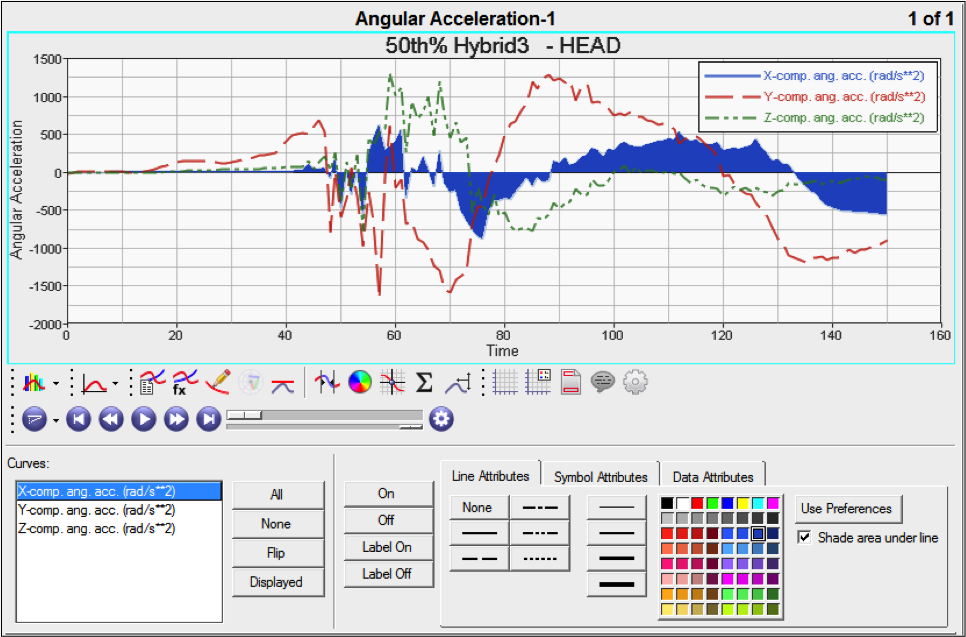
<?xml version="1.0" encoding="UTF-8"?>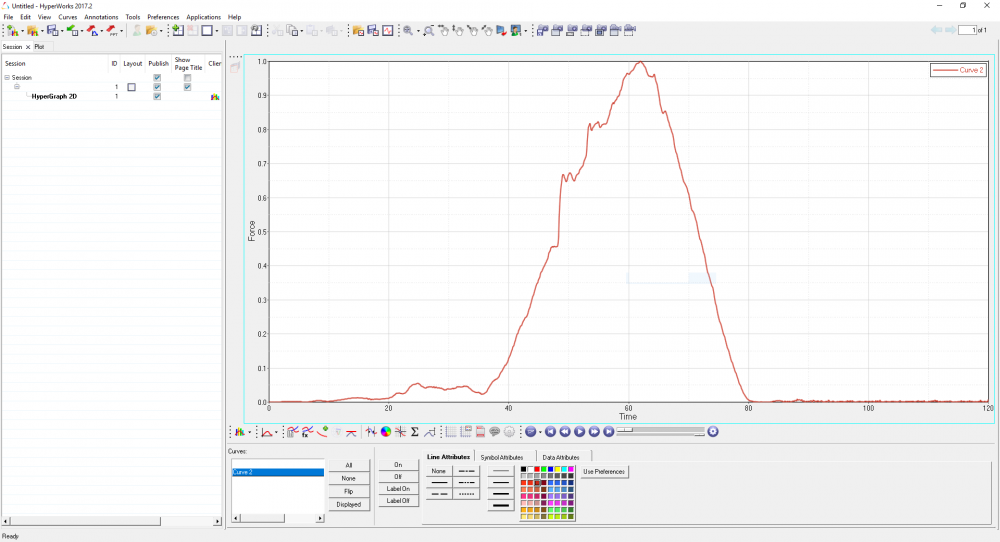
Does anyone have an idea how to solve this? (Or any other method to color the area under the line?)
Kind regards,
Robbin