The Siemens Community Catalyst program was co-created with our community to acknowledge technology leaders who consistently contribute to the Siemens Community. Nominations are accepted on a rolling basis.
Hi,
Is it possible to overlay a XY plot on a bart chart. How can I do this ?
Benjamin
Hi Benjamin,
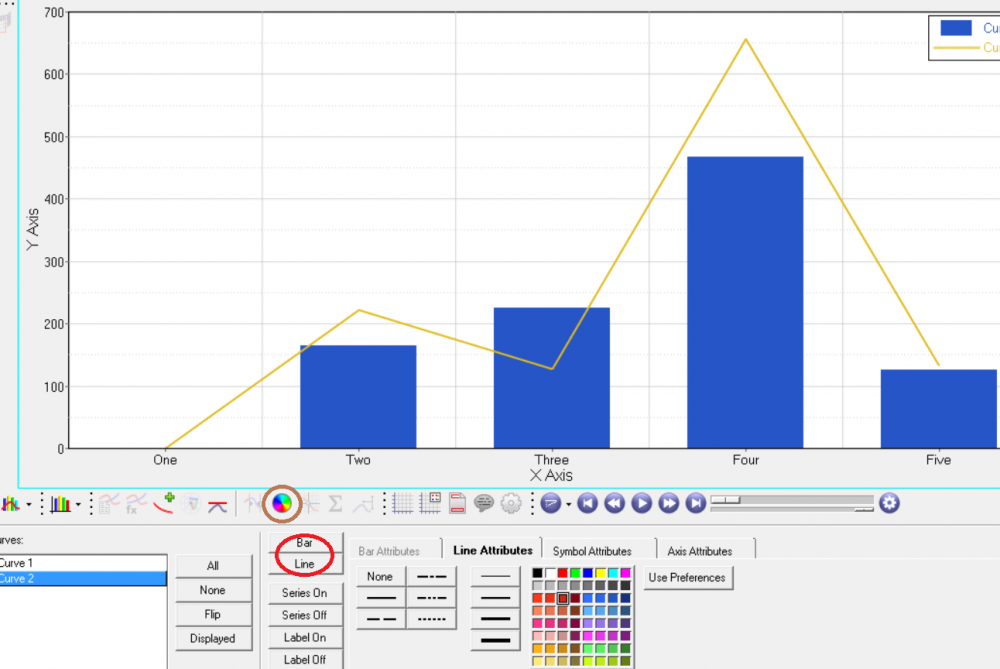
As a workaround, can you try with the Bar and Line option available in Curve Attributes Panel of bar chart. This option enables you to view your data as a bar chart or a line curve in the display.
<?xml version="1.0" encoding="UTF-8"?>