The Siemens Community Catalyst program was co-created with our community to acknowledge technology leaders who consistently contribute to the Siemens Community. Nominations are accepted on a rolling basis.
Hello, When I do the FRF analysis and visualize the responses in Hypergraph they appear as magnitude and phase, how can I get these answers in rectangular coordinates (real and imaginary) directly?
In below post i shared tutorial for plotting complex results.
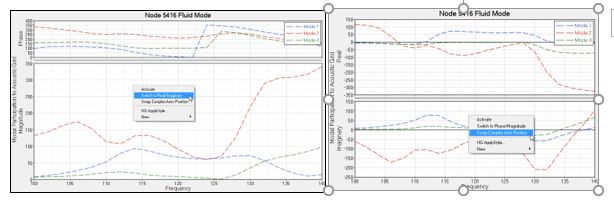
Once a Complex Plot has been created, you still have the option to switch whether you are plotting phase/magnitude or real/imaginary.
In the example , the plot is created first and it contains phase/magnitude data.
By right clicking in the Graphics Area and selecting Switch to Real/Imaginary, the real/imaginary curves can be created. You can then switch back by selecting Switch to Phase/Magnitude.
<?xml version="1.0" encoding="UTF-8"?>