Hi,
I ran VWT steady state analysis (10 time steps). After the analysis, in the report, I have all the data for pressure contours, coefficient etc.
But, I can't see the values associated with them ?
For e.g. - pressure/velocity contours , the value obtained is not available on the legend,
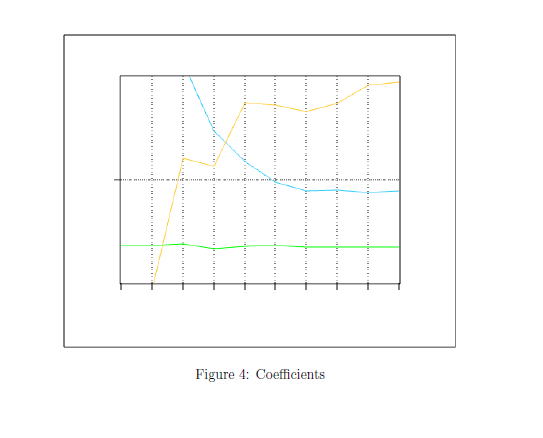
For drag plots, no information is there on the x.y axis .Snapshot attached.
I had run same analysis on my friend's system - there I could see the values in each figure.
Kindly help me in sorting this out. Is there any setting , I need to change w.r.t my system ?
Looking forward to your response.
Thank you
Regards
Garima
<?xml version="1.0" encoding="UTF-8"?>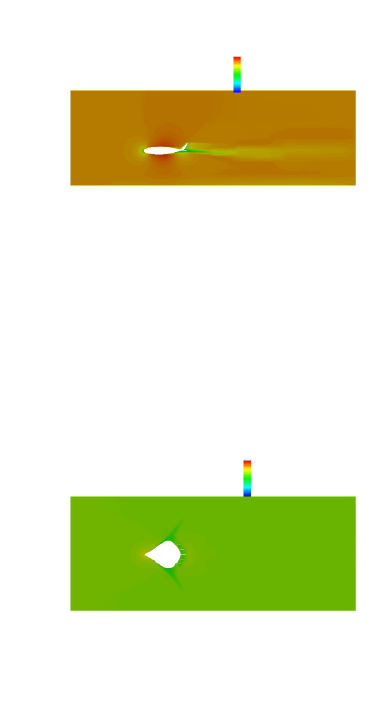
<?xml version="1.0" encoding="UTF-8"?>