compose with python graph

User: "Altair Forum User"
Altair Employee
Updated by Altair Forum User

Hello All.


I attached 'oml' and 'py' file.


In python

1.

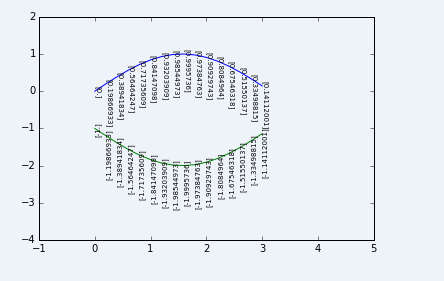
    There are x and y limit

      -   plt.ylim(-4,5)

     -    plt.xlim(-1,5)

   But it doesn't work. How can I make it work correctly?


2. How can i save the python graph with bmp type image?


<?xml version="1.0" encoding="UTF-8"?>test.png

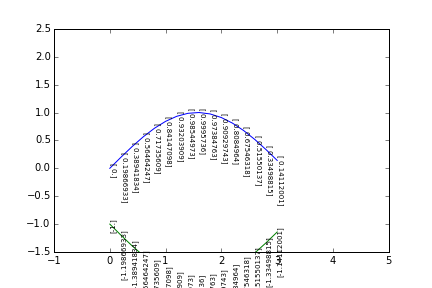
Unable to find an attachment - read this blog

Find more posts tagged with

Sort by:
1 - 3 of 31
    User: "manoj kandukuri"
    Altair Employee
    Updated by manoj kandukuri

    Hi Seoksan,

    In the python file you have axis set to 'equal' and that is trying to make the axis limits to be equal. comment the line 'plt.axis('equal')' and you can set the ylim and xlim as you requested.


    #plt.axis('equal')
    # axis limts
    plt.ylim(-4,2)
    plt.xlim(-1,5)


    image.png.6a79d490887aeb267aea977b99bca769.png


    Hope this helps 


    MK

    User: "Altair Forum User"
    Altair Employee
    OP
    Updated by Altair Forum User

    Thank you, Manoj


    Do you know why my 'ylim' doesn't work?


    User: "manoj kandukuri"
    Altair Employee
    Updated by manoj kandukuri

    Seoksan,

    I'm not sure why it didn't work but when i searched online, i found this is due to possible bug in axis('equal') - equal scaling by changing the limits when clf is refreshed, this causing the ylim changes to fade out.

    ( see https://github.com/matplotlib/matplotlib/issues/8093


    Thanks,

    Manoj kandukuri