Cannot understand the result
Hi,
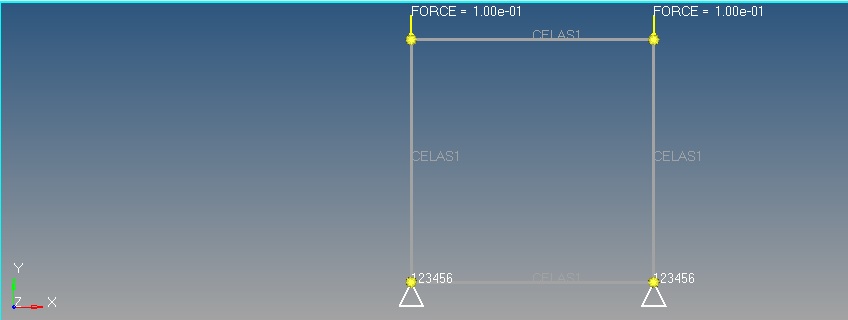
I'm trying a basic analysis using a 1D spring element to study its effects under compression(image:loading conditions) and tension.
K= 0.1
GE= 0.5
S= 1
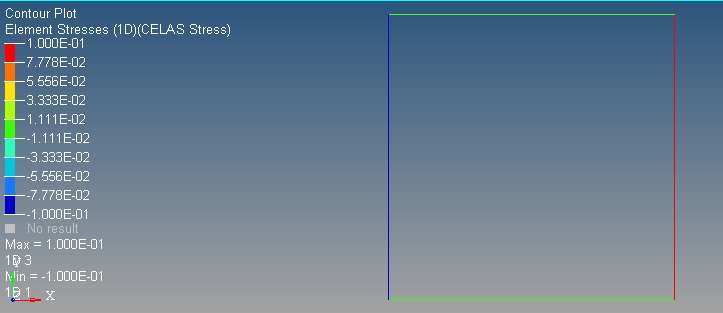
The values are arbitrary as this is just a benchmark test. Could someone please look at the attached images. I would think instead of there being a blue and red line. The 1D elements both should be of the same magnitude and direction. Thus depicted in red. I'm not understanding why there is a negative stress value on one side and positive on the other side.
Thank You
Shishir
Answers
-
What unit system you have maintained in your model?(Force,K,GE,S)
0 -
Hi,
Thank you for writing back.
Force is in N.
Distance in mm.
K = N/mm, S = N/mm2.
Could you please let me know how the unit system is related to the result above. The magnitude of the stress is same, only the sign is varying.
0 -
Just for my understanding i ask.Magnitude of force is too low.If possible share your files we will take a look and update you.
0 -
I hope it is not a problem to attach the file here? I will also send a Body centre cube modeled using 1D elements, in which you can also see the same problem in the result, where 3 edges are in blue and one in red. The magnitudes are same but the sign convention is changed.
Coming to the point about the force being too low, same was tested on abaqus and there was no problem with the result. The 1D springs are of 0.01mm length.
0.1 N should be enough to cause desirable effects.
Thank you
Shishir
0 -
I feel this is a intended behaviour for CELAS1 element.When i pick individual element (Left hand side element) i see blue colour contour with magnitude of 1e-01. Same output comes for right hand side element.
If you want to see varying colour for Stresses then you must have multiple celas1 element instead of one celas1 element.
Even if you try same simulation with beam or rod element you would get similar contour.See attached result for Rod element.
0 -
Thank you very much for your response. Since this is a small setup and had only 4 1D elements, I could use multiple here, but i'm trying to simulate something that would require around 1000 1D elements. I'll see what i can do with this.
If I could trouble you for more, is there anyway, I can use a sine wave or a cos wave or a gaussian pulse to analyze the cube that I had sent using optistruct. I'm aware of RADIOSS having wave propagation examples, but my experience is mainly on linear statics and i'm much more familiar with optistruct. The idea is to create S-Waves and P-Waves inside the cube by using a time dependent sine or cos wave as load.
0 -
Please feel free to post queries related to HW tools.I didnt get your term S-Waves and P-Waves .If you are talking about Transient response & Frequency response cases then HW Optistruct would be ideal tool.
0 -
I'm sorry for not elaborating, When a sine wave or any pulse excites a structure, shear waves (s-waves) & pressure waves (p-waves) are induced into it.
I would like to know, if there is a way, a sin wave or cos wave can be used as load.
The other option is to try to load in a way that max amplitude is applied at a time, for example t=0.25 secs. then the component is under no load for 0.25 secs and then the load is applied again. so, the component observes load and no load for every 0.25 secs for a specific amount of time. This makes it transient or time dependent analysis. I'm not sure how to use this in HyperMesh, in theory, its just, x axis as time and y axis as amplitude. I have to create Dload and add a tabled1 with these values in optistruct so it works as I intend, i think.
0 -
We have set of Frequency response & transient response analysis tutorials for Optistruct.I believe above one query is of same type(Dynamic Analysis).Also refer Optistruct user guide for detailed information.Please do let us know if you come across any issue using Optistruct.
0 -
Altair Forum User said:
I would like to know, if there is a way, a sin wave or cos wave can be used as load.
Hi,
You can make a graph (in .CSV format or any other format) and you can use the same for Transient analysis. This can be used as an input via TABLEDi card in OptiStruct.
0