Hi sir,
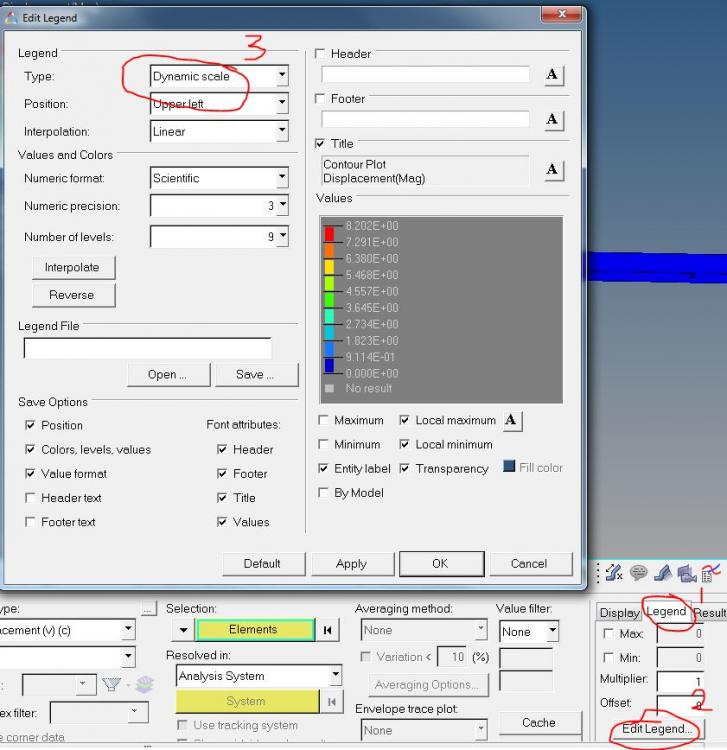
When I am seeing the contour plot of maximum acceleration in X direction at 1000Hz, I get a maximum value of 2.72E3.
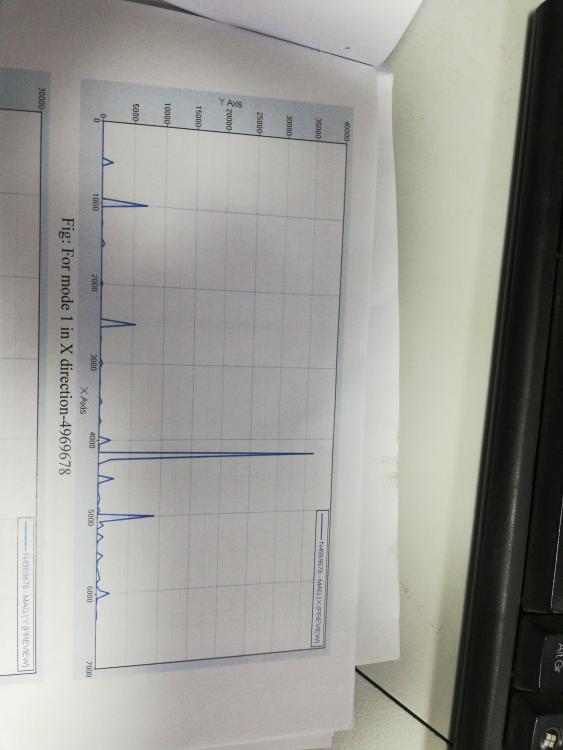
Now I selected a node from the region where we find maximum acceleration (red zone) and plot a graph in X direction at 1000Hz using hypergraph.
I should get maximum peak as 2.72E3 because the contour plot says so.
But I am getting the peak at around 3.7E4
Why is this difference coming?
<?xml version="1.0" encoding="UTF-8"?>
<?xml version="1.0" encoding="UTF-8"?>