Pull Out Sandwich Analysis
Hello,
I am simulating a pull out test.
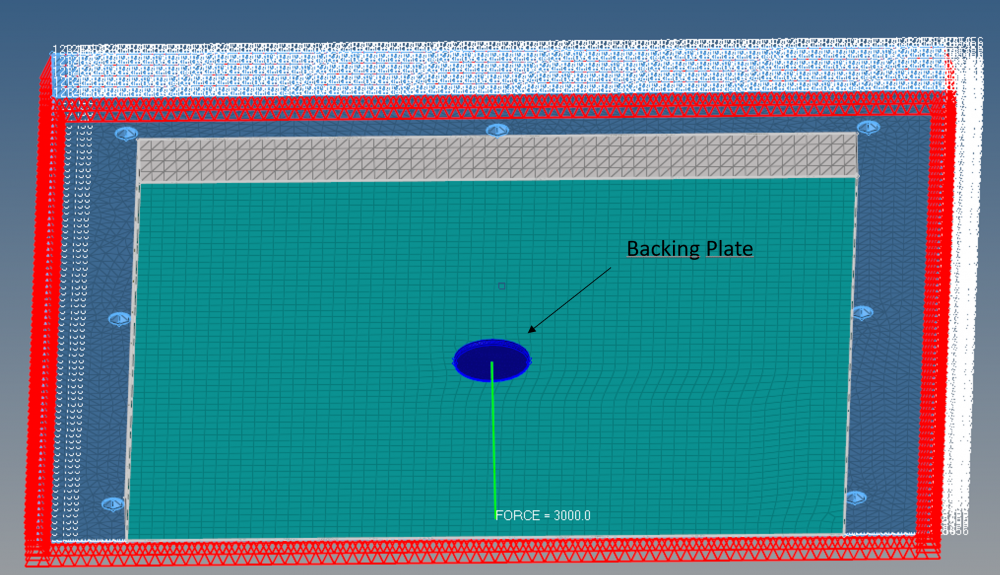
I built my model in accordance to some tutorials using a 3D mesh with mat9ort and PSolid to the honeycomb and two 2D mesh to the carbon fiber layers with mat8 and Pcompp.
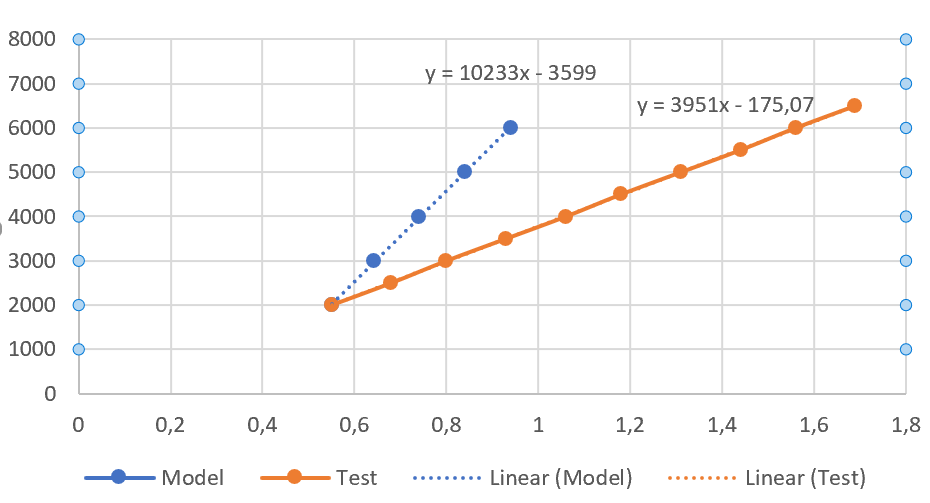
After the model is running i made a test specimen and test it. The problem is that my model is much more rigid than the real life (see the graph).
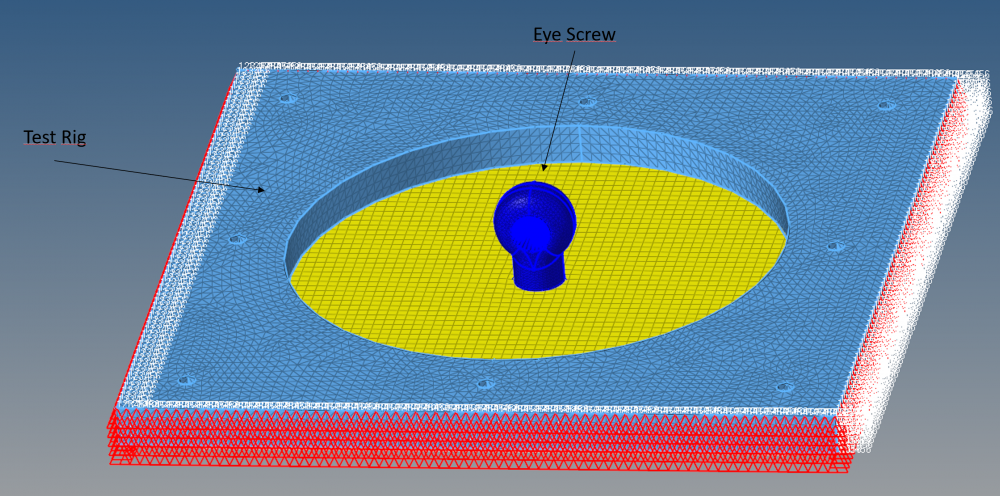
To apply the force i use an eye screw and a backing plate that i had modeled too and used some contacts between the test rig and the plate and between the backing plate and the sandwich plate. These are the only constraints applyed to the sandwich plate.
Could someone help me with this? I dont know why there is this difference between the model and the real test
Attached is the model
<?xml version="1.0" encoding="UTF-8"?>
Answers
-
Could anyone help me?
@Ivan @Rahul Ponginan @Rahul R , sorry for tag you but i'm really stuck in this problem
Thanks in advance
0 -
I believe you have some modelling inconsistency in your model.
Upper arm thickness coincide with parte cima.
Define contact between puxator and upper arm or honeycomb.Try all with freeze contact.
Not sure about the graph.Is that Displacement vs Force graph?
In above shared screenshot force magnitude is 3000 however in shared file it is 2500.
Can you also share .out file of the run?
<?xml version="1.0" encoding="UTF-8"?>
0 -
Hi @Rahul R yes it is force vs displacement graph.
This is a pull out so i'm thinking that the upper part of puxator could leave the surface with a really big force so because of that i put the contact only in the low part of puxator.
So you think that i should take into account the layup thickness when making the contacts?
0 -
AS requested the .out file
0 -
@Rahul R i tried to change the distances between the elements because of the interception you talked about and the results change a little but not that much. Have you checked the .out i sent you?
0 -
the sliding contact is the key for correlation IMHO.
Sliding contact might not work using linear static analysis. In linear static analysis, the contact status does not change, does not slide and the contact stiffness is constant throughout.
I tried with non-linear quasistatic (NLSTAT) and got slightly larger Y displacement (0.21 vs 0.19).
0 -
Hi @Ivan could you send me the model with NLSTAT?
And do you know if it is possible to do the laminate optimization process (free size, size and shuffle) using a non linear quasi static analysis?Thanks in advance
0 -
Hi,
the model is attached.
It is possible to perform laminate optimization using a non-linear quasi-static analysis. This model is not best suited for NLSTAT, because it takes a long time to solve a single run and optimization takes a number of iterations. CNTSTB is used for automatic contact convergence. Sliding contacts are computationally expensive- even more so if friction is considered. Using linear static analysis with freeze contact would be much more computationally efficient.
- If the objective is to maximize stiffness subject to volume/mass/mass fraction constraint, using linear static analysis would give satisfactory results.
- If the objective is to minimize mass subject to stress or displacement constraints, NLSTAT would be recommended to capture nonlinearities thereby predicting stress and displacement more accurately.
0 -
Thank you @Ivan!
Do you know any way to take a graph force vs displacement to compare to the real test? Like using and incremental force or something like that
0 -
The DISPLACEMENT and GPFORCE have to be requested in ANALYSIS>CONTROL CARDS-GLOBAL_OUTPUT_REQUEST. Incremental result output is defined by NLOUT. If user wants to maintain the increment size, PARAM>EXPERTNL should be turned off.
Then you can plot force vs displacement using cross-plot
https://community.altair.com/community?id=community_question&sys_id=c586c83a1b2bd0908017dc61ec4bcb4eUse the following simplified model for practice:
0