
New and Improved capabilities in the new HyperGraph 2022 user interface

 Altair Employee
Lets take a look at some of the important new and improved capabilities in the HyperGraph new interface.
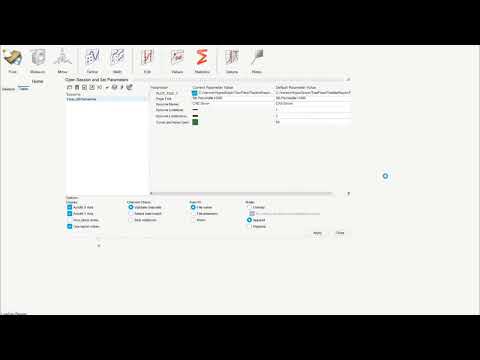
Table Client
Table client has been migrated to Qt
 https://www.youtube.com/watch?v=kHZSW4JtEr8
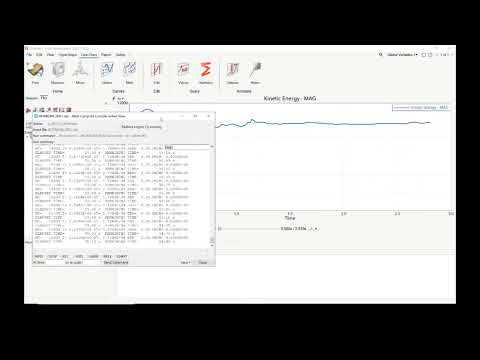
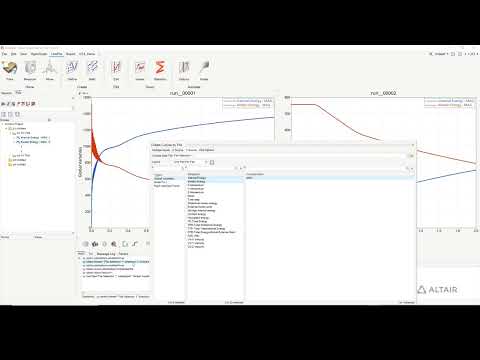
Dynamic Results
Plotting from HG while solver is running
 https://www.youtube.com/watch?v=E02Bfx8Opnc
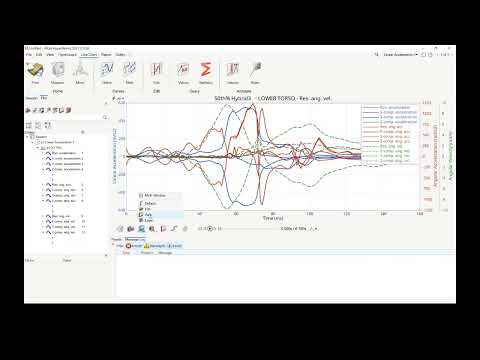
Plot Colors
Color by file, axes and layer as well as multi window support
 https://www.youtube.com/watch?v=awpFhPS3g34
Stack Math
Using Stackmath to Edit Curves
 https://www.youtube.com/watch?v=DTx-I_5yAAI
Cora and ISO curve correlation
Use Cora and ISO to plot correlation metric between test and CAE
 https://www.youtube.com/watch?v=u8b3J82gWwk
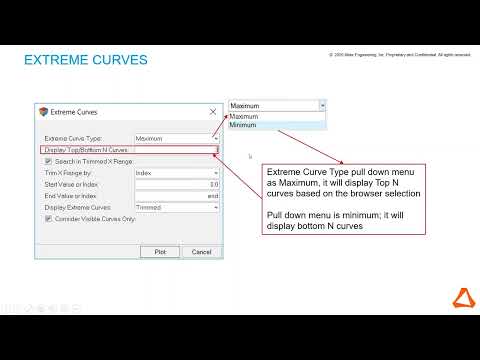
Extreme Curves
Filter out maximum and minimum contributors from the displayed curves.
 https://www.youtube.com/watch?v=KuM8WSyQopk
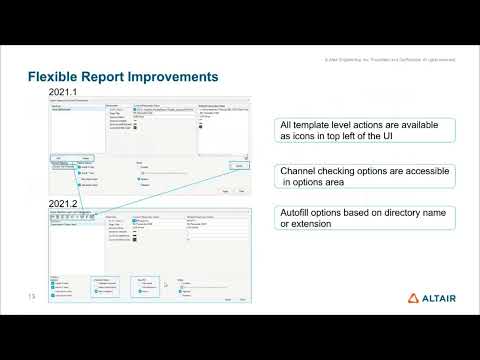
Flexible Report templates
Access all template level actions, channel checking options and auto fill options in the main UI.
 https://www.youtube.com/watch?v=ixKbYNSn9_8
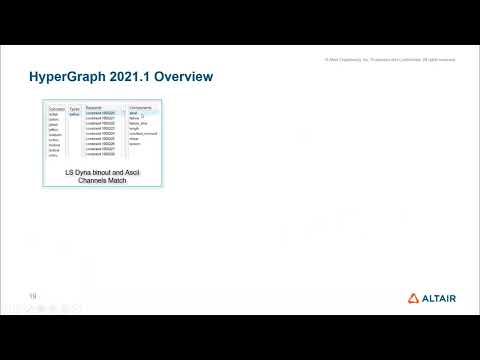
ASCII Reader Enhancements
LsDyna Reader enhancement to match binout and ASCII file TRC's.
 https://www.youtube.com/watch?v=lKPnfxE-zKk
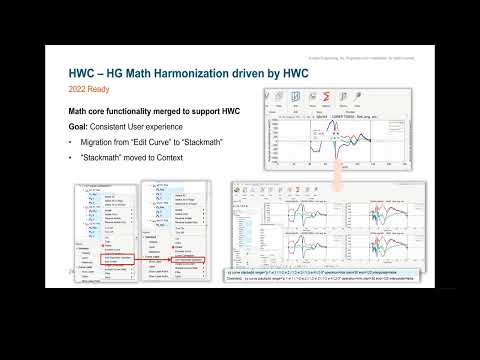
HyperWorks Command (HWC) language, Record and Playback in HG
The HyperWorks Command (HWC) language records playback workflows in HyperView and HyperGraph, together with the handling of Sessions Report templates. Tasks performed in the browser, panels, or graphics area are recorded in a simple and intuitive syntax in the command history window below the panel.
 https://www.youtube.com/watch?v=enxusIjFtwk