Shock Response Spectrum (SRS) curve

 Altair Employee
Hello everyone,
Regarding some Shock's analysis demands, I've decided to facilitate and automate (using Activate) the task to obtain the expected Shock Response Spectrum curve as below:
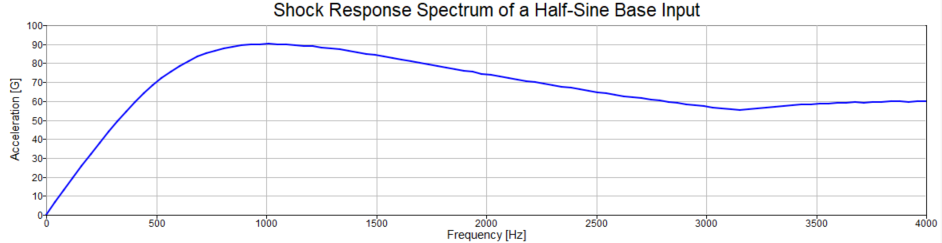
This model will be very useful for those who are intending to do some Shock's analysis, even a linear approximation using the amplification factor on a certain frequency, as a Response Spectrum covering all the frequency domain.
Basically the inputs are the Half-sine and System properties:
- Sine: Magnitude, period, phase.
- System: Mass, damping, stiffness.
After set them, you'll just have to click 'Run' and then 'Execute'. Besides the traditional plots (Acceleration (G) vs. Frequency (Hz)) you will already have the 'TABLED1.fem' to be used on OptiStruct, as can be seen in this video.
Hope this be very useful for you all! Please, let me know if you have any question about this model (attached).
João.
Find more posts tagged with
Sort by:
1 - 2 of
21
Thanks for sharing this. Very useful!
Awesome! The video is also helpful.
Thanks for sharing this.