Hello,
I have a component as seen below. I'm struggling to find out how to, if possible, plot of graph of Shear Stress vs Displacement.
By using a node path you only get stress at that node however I need something more complex.
I need to average the total stress for elements in the x and z axis at certain y displacements. Then plot, y displacement vs Shear stress average plane.
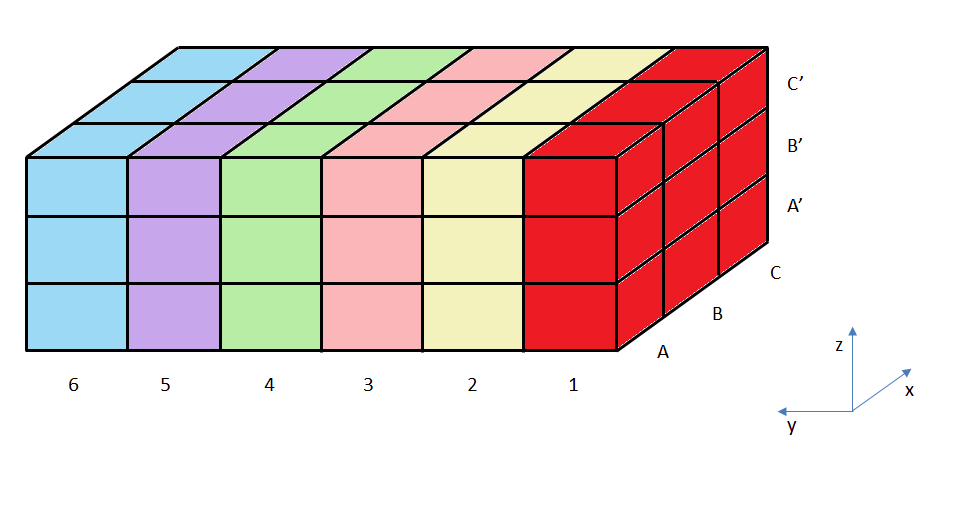
Still confused? See diagram 2 below for example.
I need to average all the elements in their specific colour, then plot the y displacement (1->6) vs shear stress (average colour).
Hope your able to help.
I'm using Optistruct as my solver
<?xml version="1.0" encoding="UTF-8"?>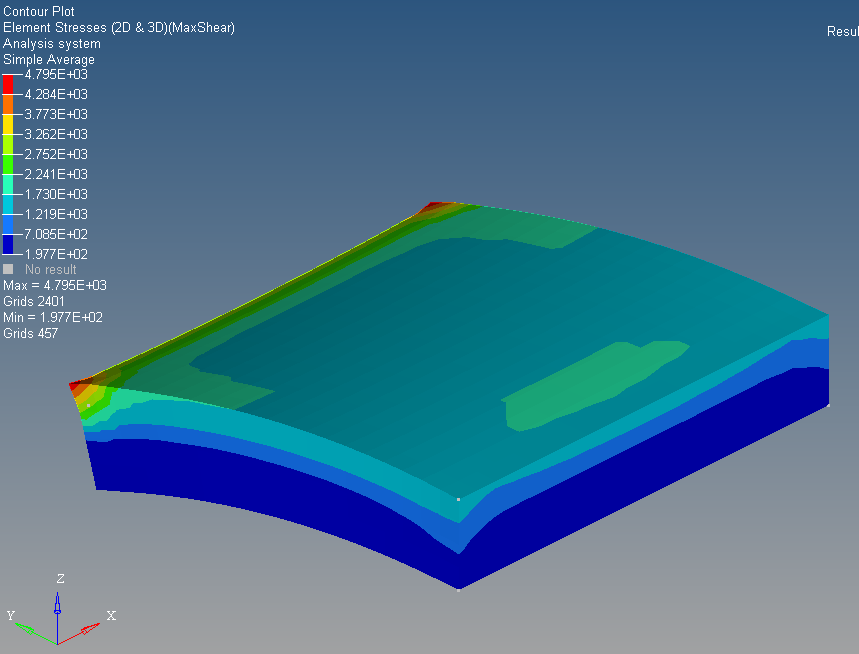
<?xml version="1.0" encoding="UTF-8"?>