The Siemens Community Catalyst program was co-created with our community to acknowledge technology leaders who consistently contribute to the Siemens Community. Nominations are accepted on a rolling basis.
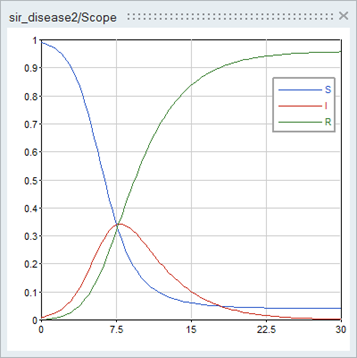
How can I make the graph like below picture.
- The legends are 'S', 'I', 'R'
- I attached scm file also.
Unable to find an attachment - read this blog
Hello,
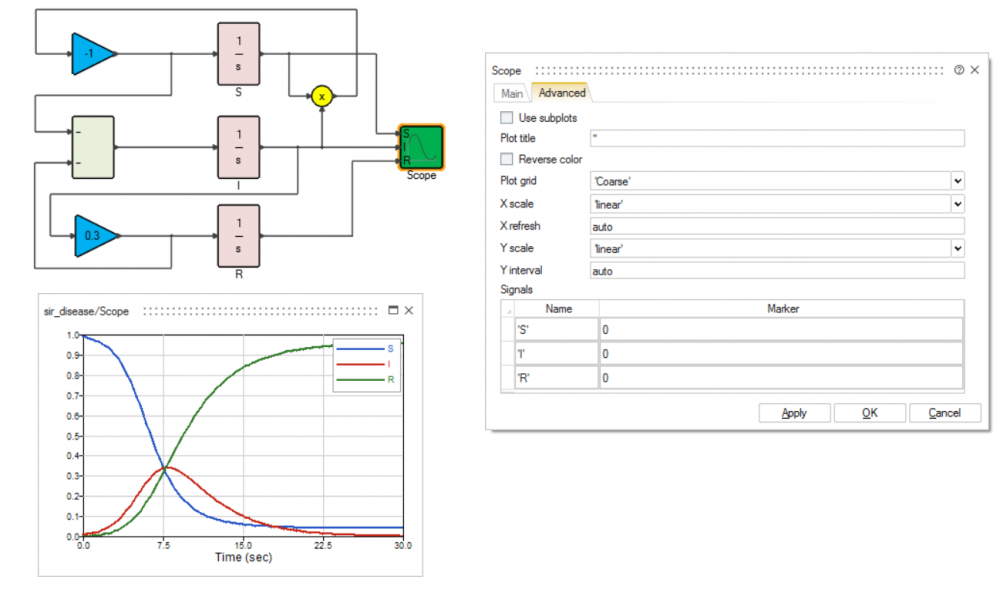
Since your inputs are scalars you can unset the 'Use subplots' checkbox in the scope parameters (Advanced tab). You can set the number of inputs to 3 and replace the mux by the scope.
<?xml version="1.0" encoding="UTF-8"?>
Which version are you using?
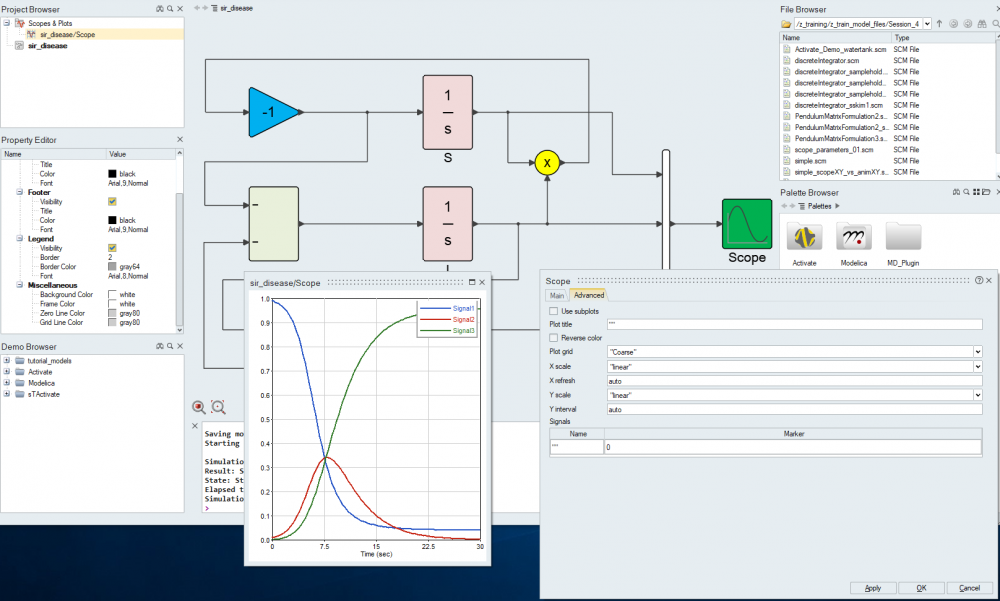
I am using 2017.3 and my scope parameter window is like below
In the 'Main' tab you can set the number of inputs to 3.
Then go back to the 'Advanced' tab you can see now three rows in the Signals table
you can set the name of the signals, each signal correspond to an input.