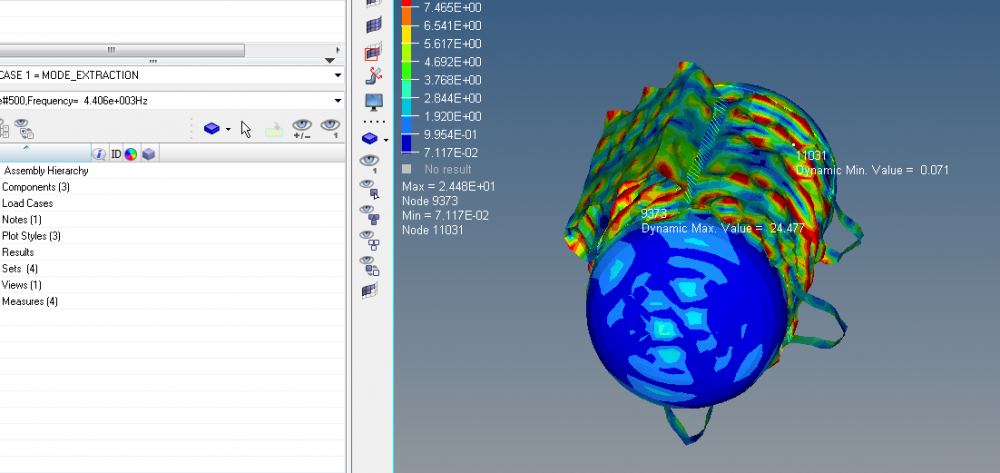
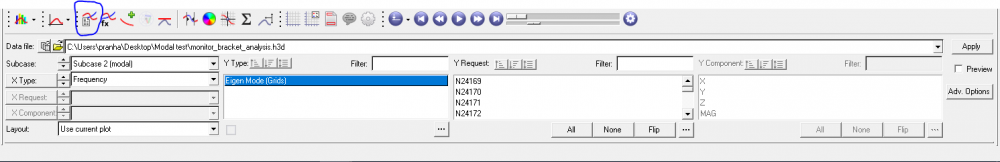
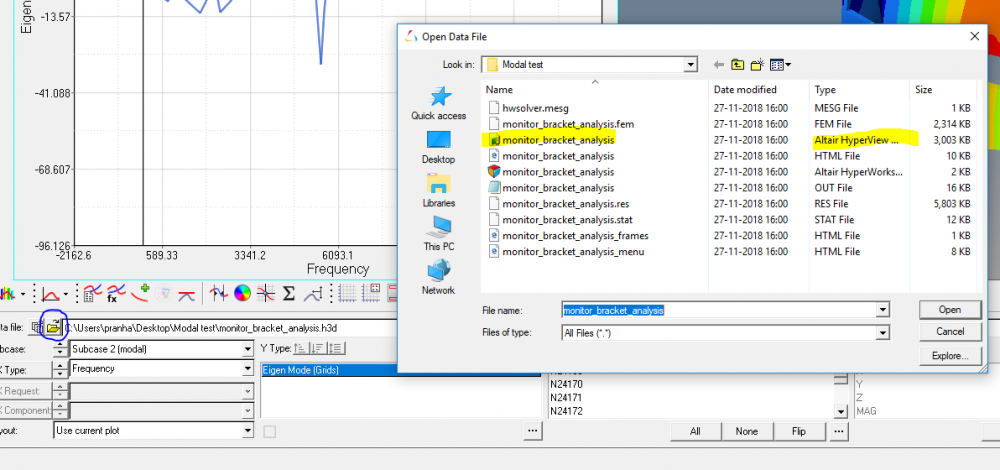
I'm a new hyperwork user so it's my first time in hyperview. I need to build a modal analysis plot and in y axis i need to have the maximum displcement while in 'x' axsis value of each frequancy. I'm not able to select the peack of each mode shape and also the frequancy values.
<?xml version="1.0" encoding="UTF-8"?>