Hi ,
I wish to know how to plot a curve from a excel file using TCL. I have currently written a code in this format
set data1 [read [open 'D:\\RWTH\\Mini thesis\\EclipseTCL\\TCL trial\\excelv1.csv']]
set result1 [regexp -all -inline -line -- {(^.*),.*$} $data1]
set firstitems {}
foreach {tmp item1} $result1 {
lappend firstitems $item1,
}
puts '{$firstitems}'
which gives me an output like this (this is the first column to be entered in the curve editor)
{0, 0.0025, 0.005, 0.0075, 0.01, 0.0125, 0.015, 0.0175, ...................75, 0.8, 0.85, 0.9, 0.95, 1,}
Similar to the above I get the 2nd column.
But how do use TCL and input this data has a curve.
I tried the below specified commands but failed to create plot
*xyplotcurvemodify 'stress strain' {$firstitems} {$items} plot
(or)
*xyplotmodifycurve 'stress strain' {$firstitems} '' '' '' 1 {$items} '' '' '' 1
*plot
<?xml version="1.0" encoding="UTF-8"?>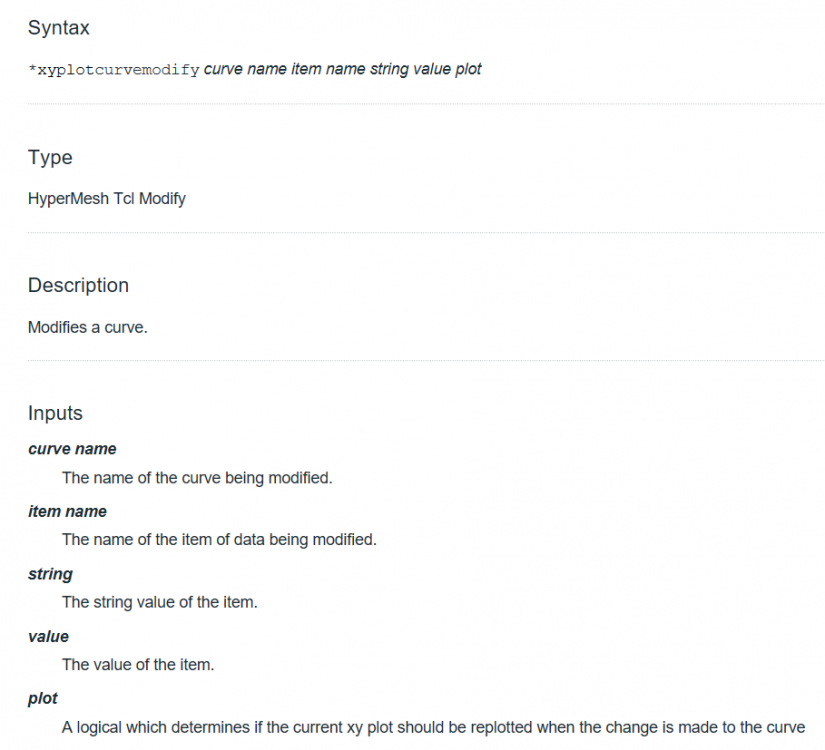
yours sincerely,
kartik
