The Siemens Community Catalyst program was co-created with our community to acknowledge technology leaders who consistently contribute to the Siemens Community. Nominations are accepted on a rolling basis.
I have a vibrating screen model and I want to calculate the total mass of the particles sieved, but my particles will flow out of the calculation domain. How can I obtain the total mass curve of the sieved material over time
Hi Jin,
you can use either bins or Total mass sensor at the inlet location and exit of the screen (i.e before the domain).
The difference of mass at inlet and outlet give you the mass retained in the sieve and any how from the exit location will get you the outlet mass
Thanks,
Prasad A
The way the dem problem statement setup looks to me wrong. i.e in general the flow rate is kg/s for that you need to use dynamic factory whereas in your deck you modelled as static factory with 100kg as total mass which means in one go your creating 100kg, however this is also wrong your deck because the static factory modelled using 2d area which creates very low mass. Static factory will create defined mass in one go at time step=0 as there is no volume for the factory it created very low mass and quick passed through the screen that's the reason, you're not able to see the particles are passing through.
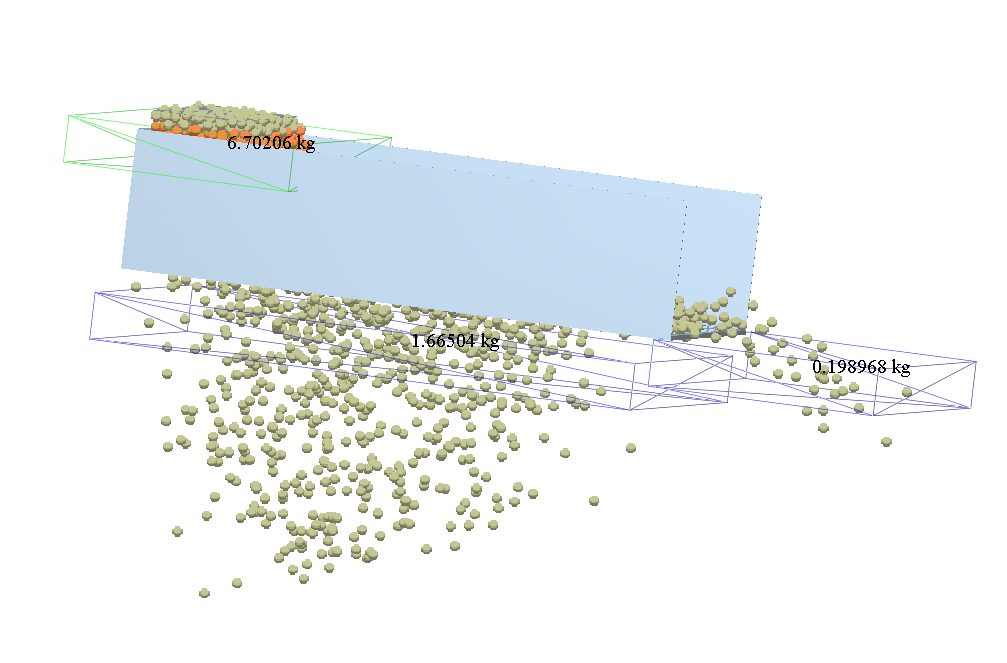
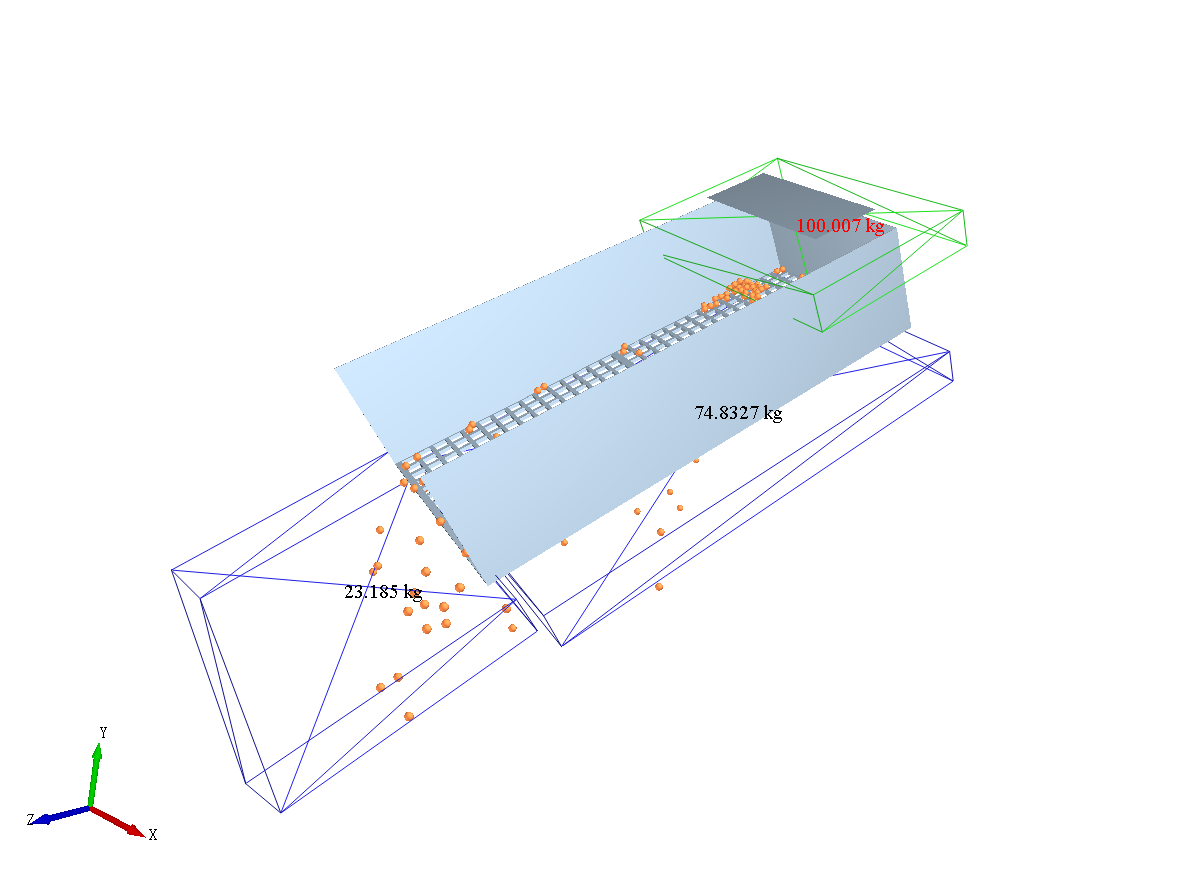
I modified simulation deck please find the attached deck and created 3 total mass sensor at inlet , oulet1 and outlet below the screen like shown in below picture.
Any kind of sensor or bin can be created similarly at the same location
Simulation deck sent to your mail id, please review and let me know if you have any more queries.
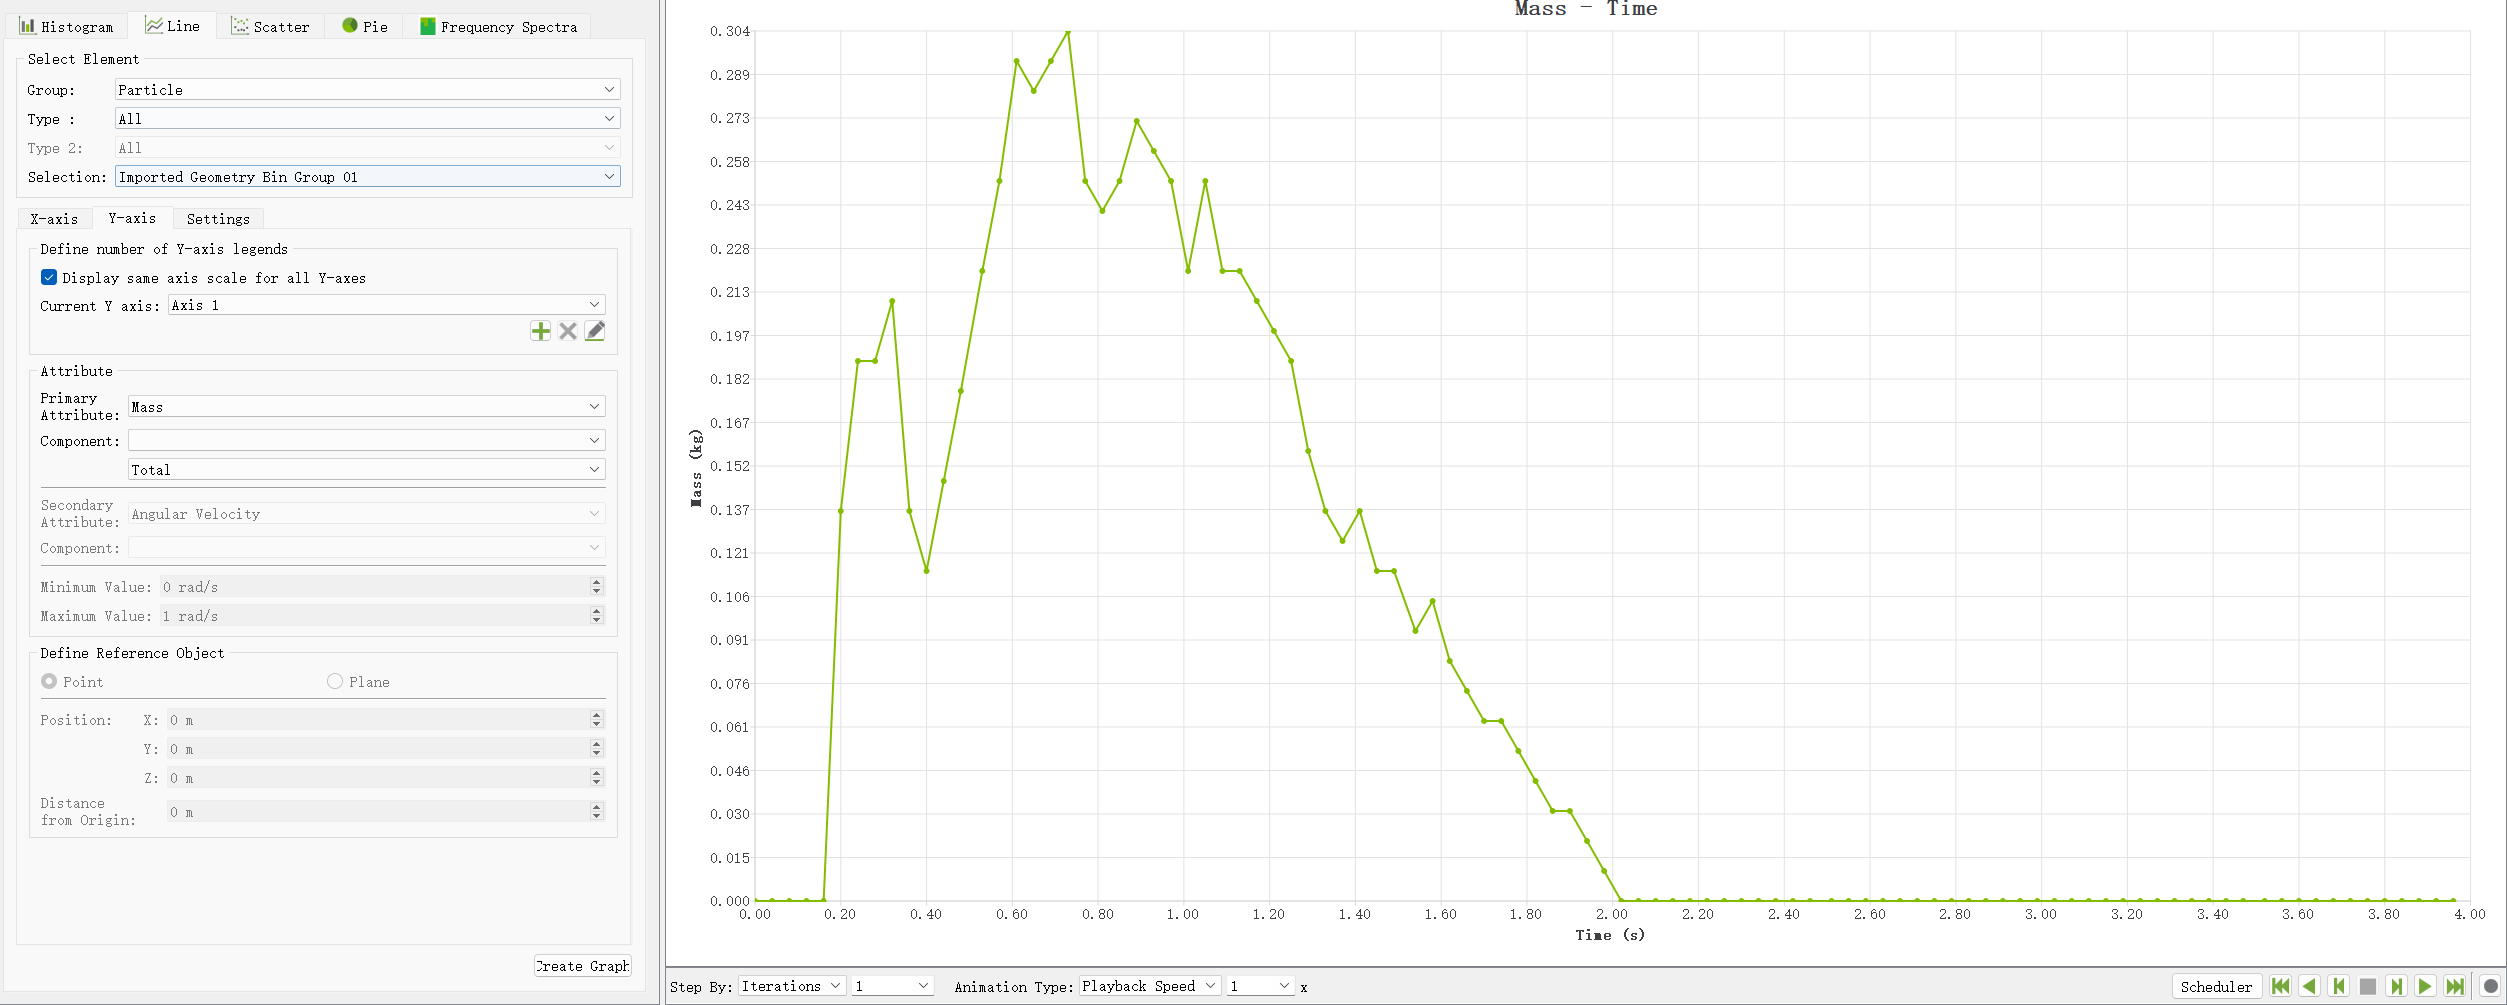
Just to confirm Mass > Total is the instantaneous mass inside the bin group. Mass > Total Over Time is the Cumulative mass which passes through.
So depending on the size of the bin the Total mass inside will increase/decrease as particles leave. Total Ove Time will always increase as particles enter the bin.
Regards
Stephen
Hi,
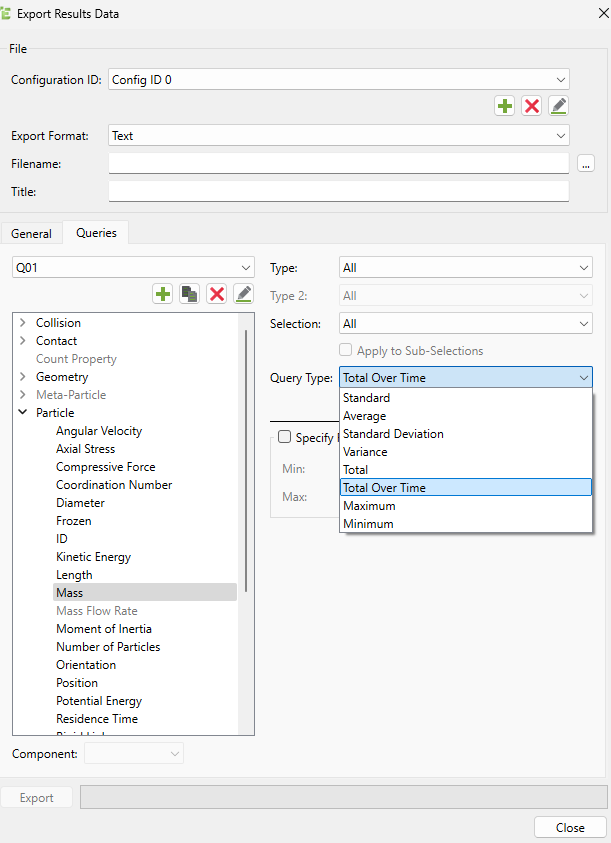
The total over time may not be available via the EDEM GUI, but in the Data Export you should have the option to export via the Analyst File > Export > Results Data
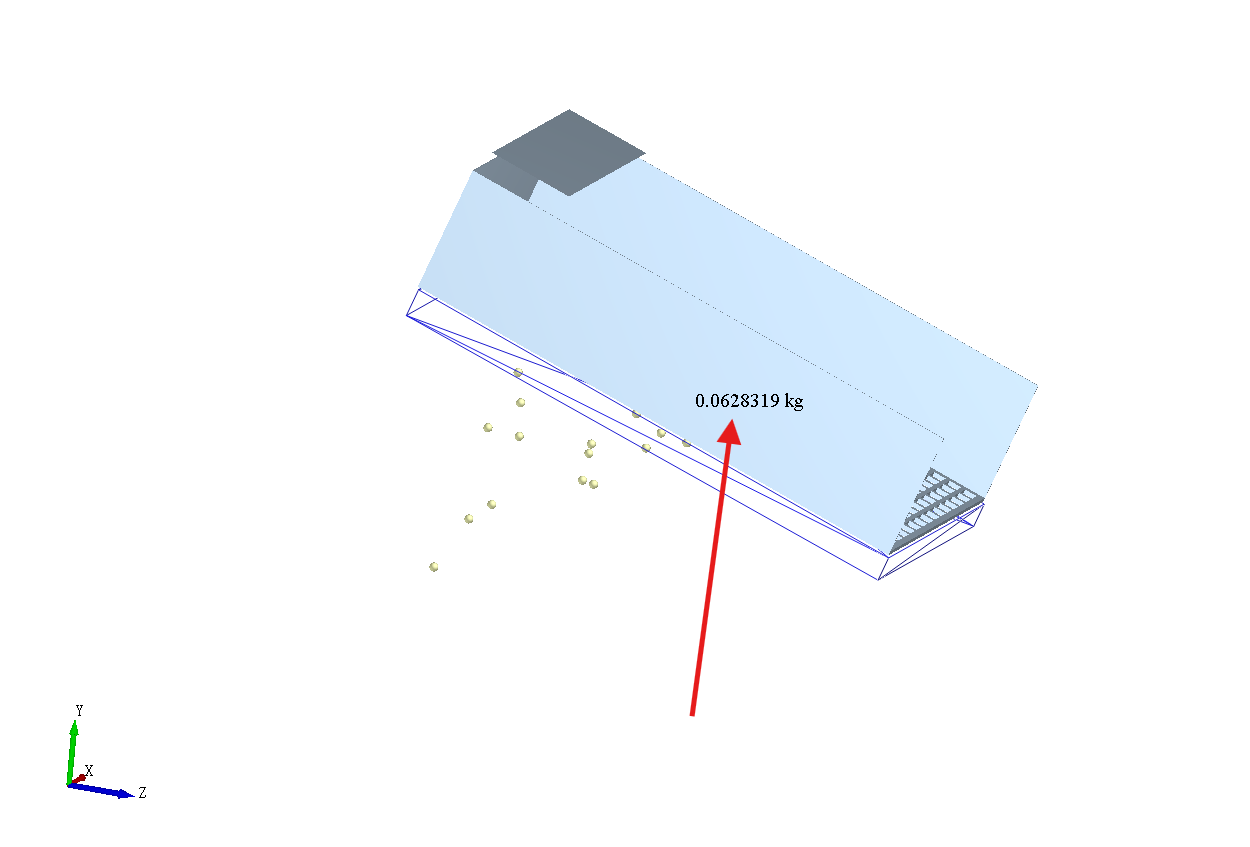
I followed the method below the image I uploaded for statistics, but in fact, as long as the particles exceed the calculation domain, they seem to be erased. The total weight calculated by the Total mass sensor is not accurate. I want to obtain the time variation curve of the particles entering this Total mass sensor, even if they flow out of the calculation domain
You need to extend the domain in EDEM to see the particles are to be extended in flow instead of getting deleted.
If the file is not confidential you can share so that we can investigate how you created the sensor and understood the sensor data.
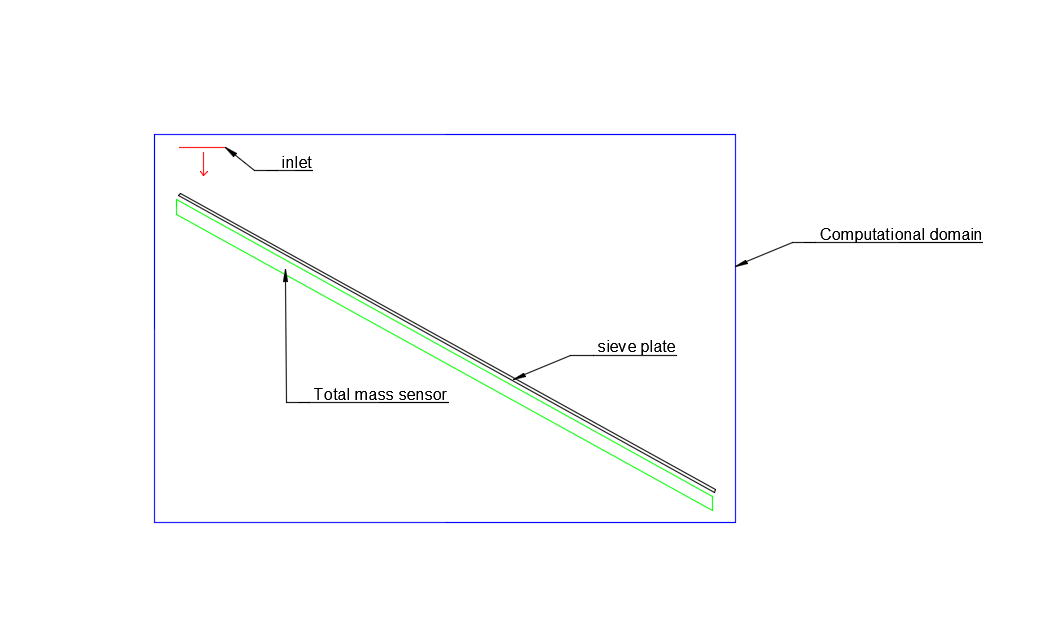
Based on the schematic diagram I drew, I randomly built a model to illustrate the problem I am currently facing. I want to calculate the total mass of the statistical domain indicated by the arrow, rather than the mass in the statistical domain at a certain moment. After observing, it seems that EDEM cannot calculate the mass flowing out of the computational domain, so the total mass obtained can only be the mass in the statistical domain at a certain moment. Once the particles run out of the computational domain, the particle information is erased. I have consulted many engineers about this issue, and it seems that EDEM software currently does not support this function. However, this function is very easy to implement in other discrete element software, and can even be said to only require a click
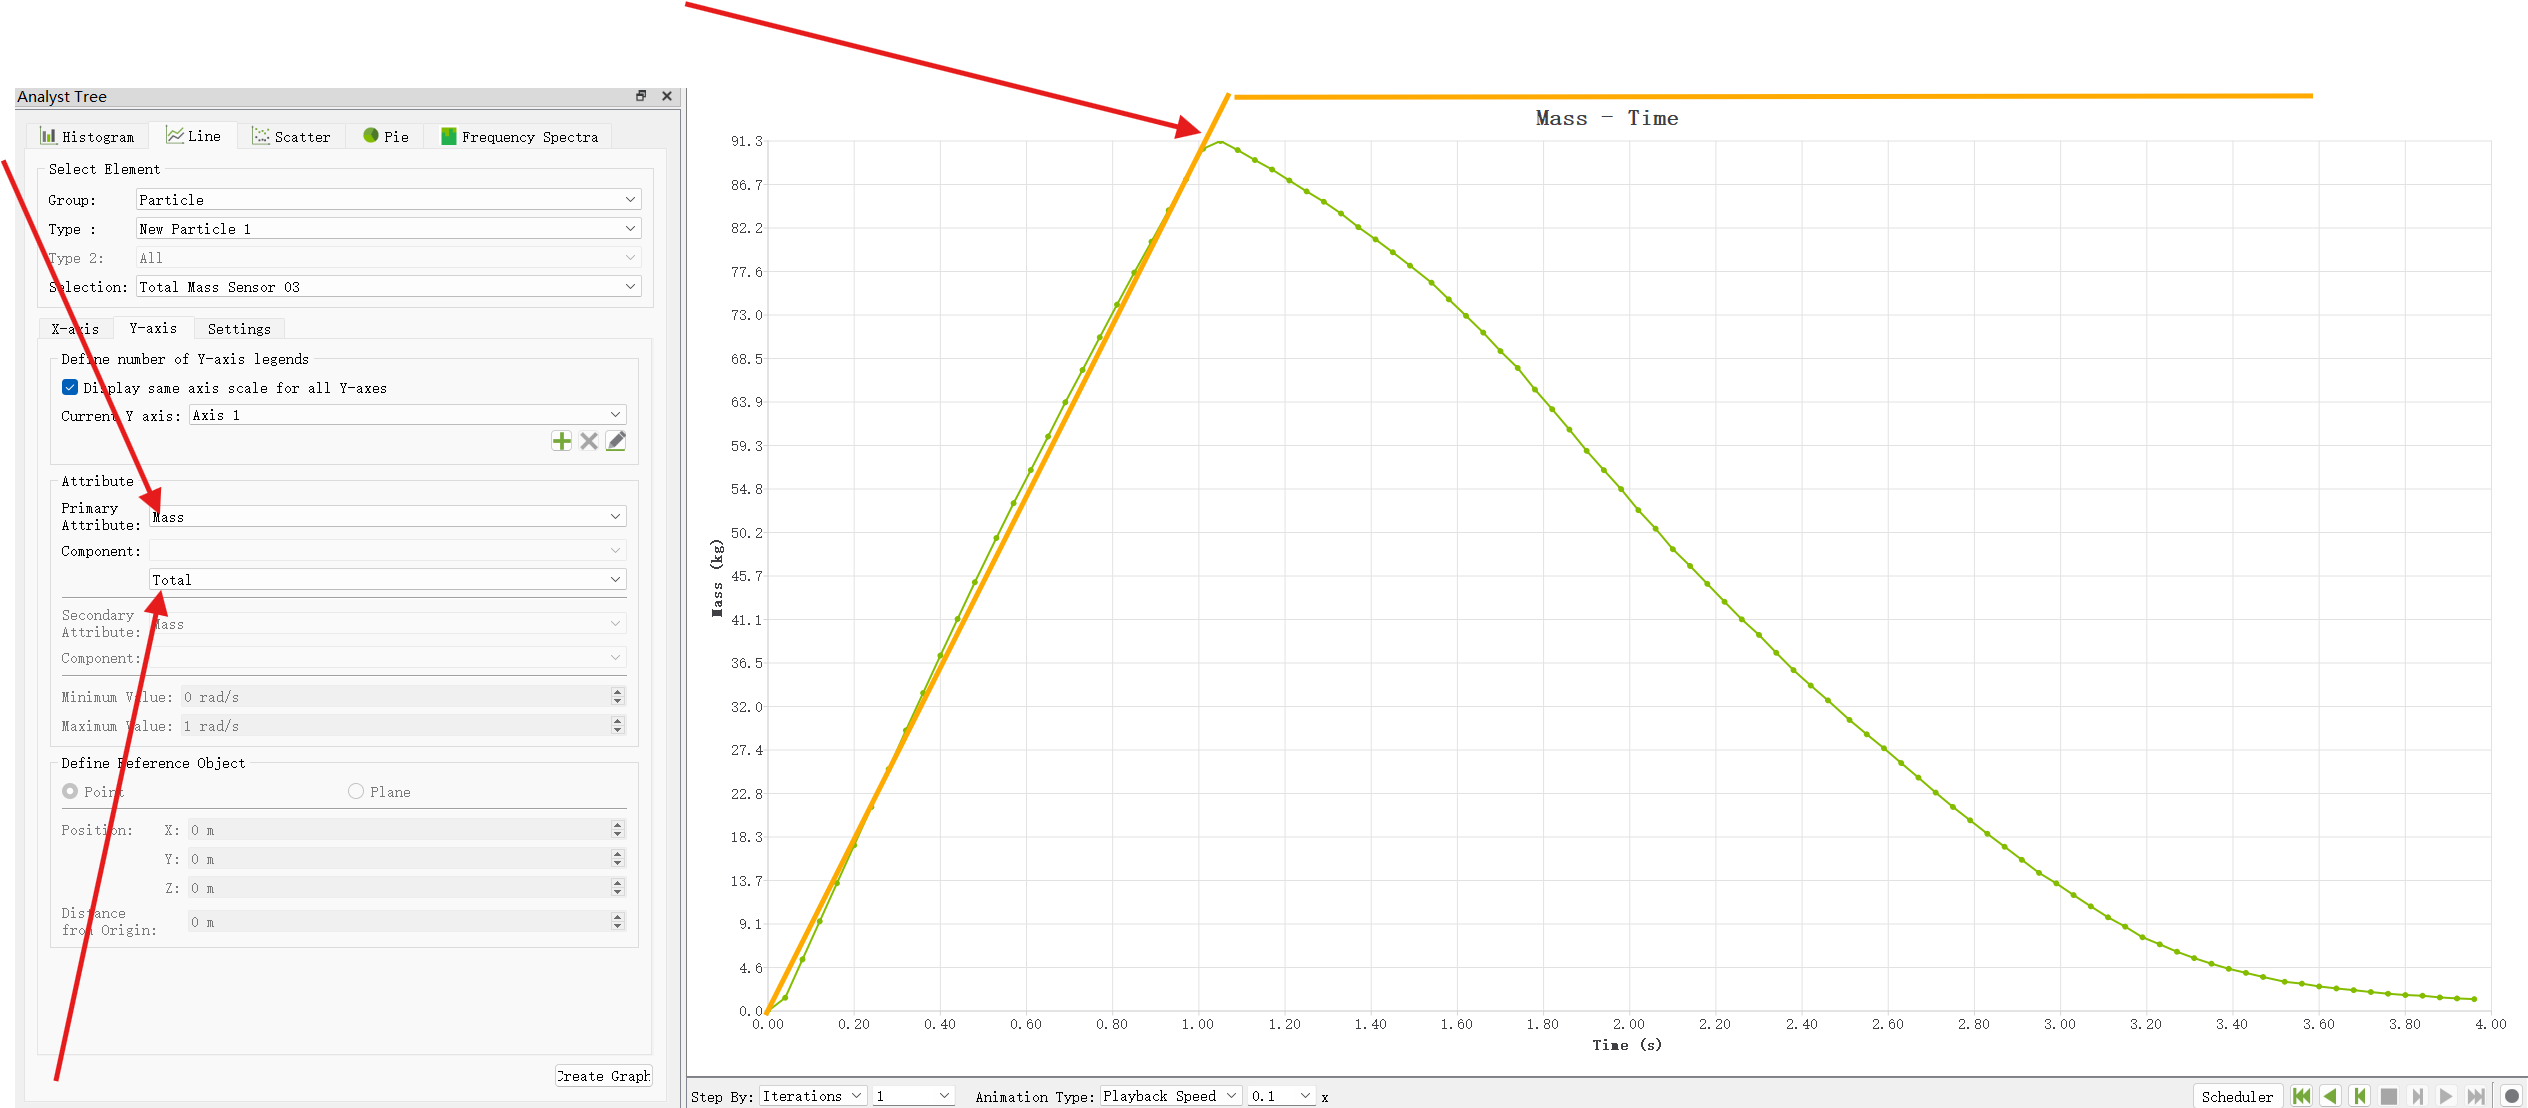
Thank you very much, this is exactly what I need. This question has been bothering me for a long time, and I have asked many people, but the replies I have received are not satisfactory. They even suggested creating a square box below to receive the particles under the sieve plate. In addition, I have obtained the numerical value of the total mass over time, but I encountered a problem when making the curve. I am now using a dynamic particle factory to generate 100kg/s of particles, and then generating for one second, a total of 100kg of particles were generated. The display of the inlet mass sensor is indeed 100kg, but the curve I obtained using MASS total does not increase linearly and then level to the end of the simulation (as shown by the yellow curve in the second figure). What is going on? Looking forward to your guidance
I understand what you're saying, but how should I plot the quality curve for Total Over Time? I only see the MASS-TOTAL curve on the post-processing interface, without the MASS -TOTAL MASS OVER TIME option. Looking forward to your guidance
OK,THANK YOU
You are the most handsome member of the Altair community, and I cannot express my gratitude to you in words