The Siemens Community Catalyst program was co-created with our community to acknowledge technology leaders who consistently contribute to the Siemens Community. Nominations are accepted on a rolling basis.
Hi all, I want to get the graphical output of these parameters, what steps should I go through, thanks a lot!
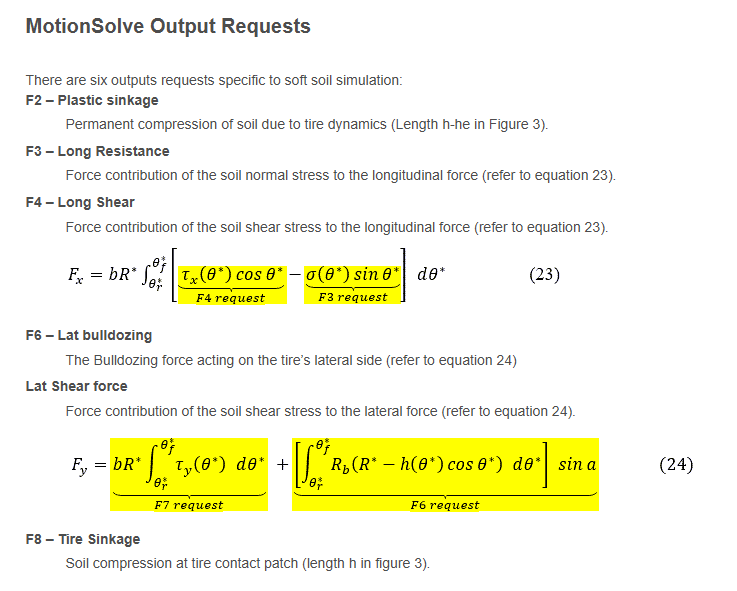
Hello @xiejiyin, for the graphical representation of any output you need to use HyperGraph to plot your data. After your simulation is finished plt, mrf or abf result files can be used to create graphs. For soft soil modeling there are the build-in outputs that you have attached in the picture and explained in soft soil tire modeling.
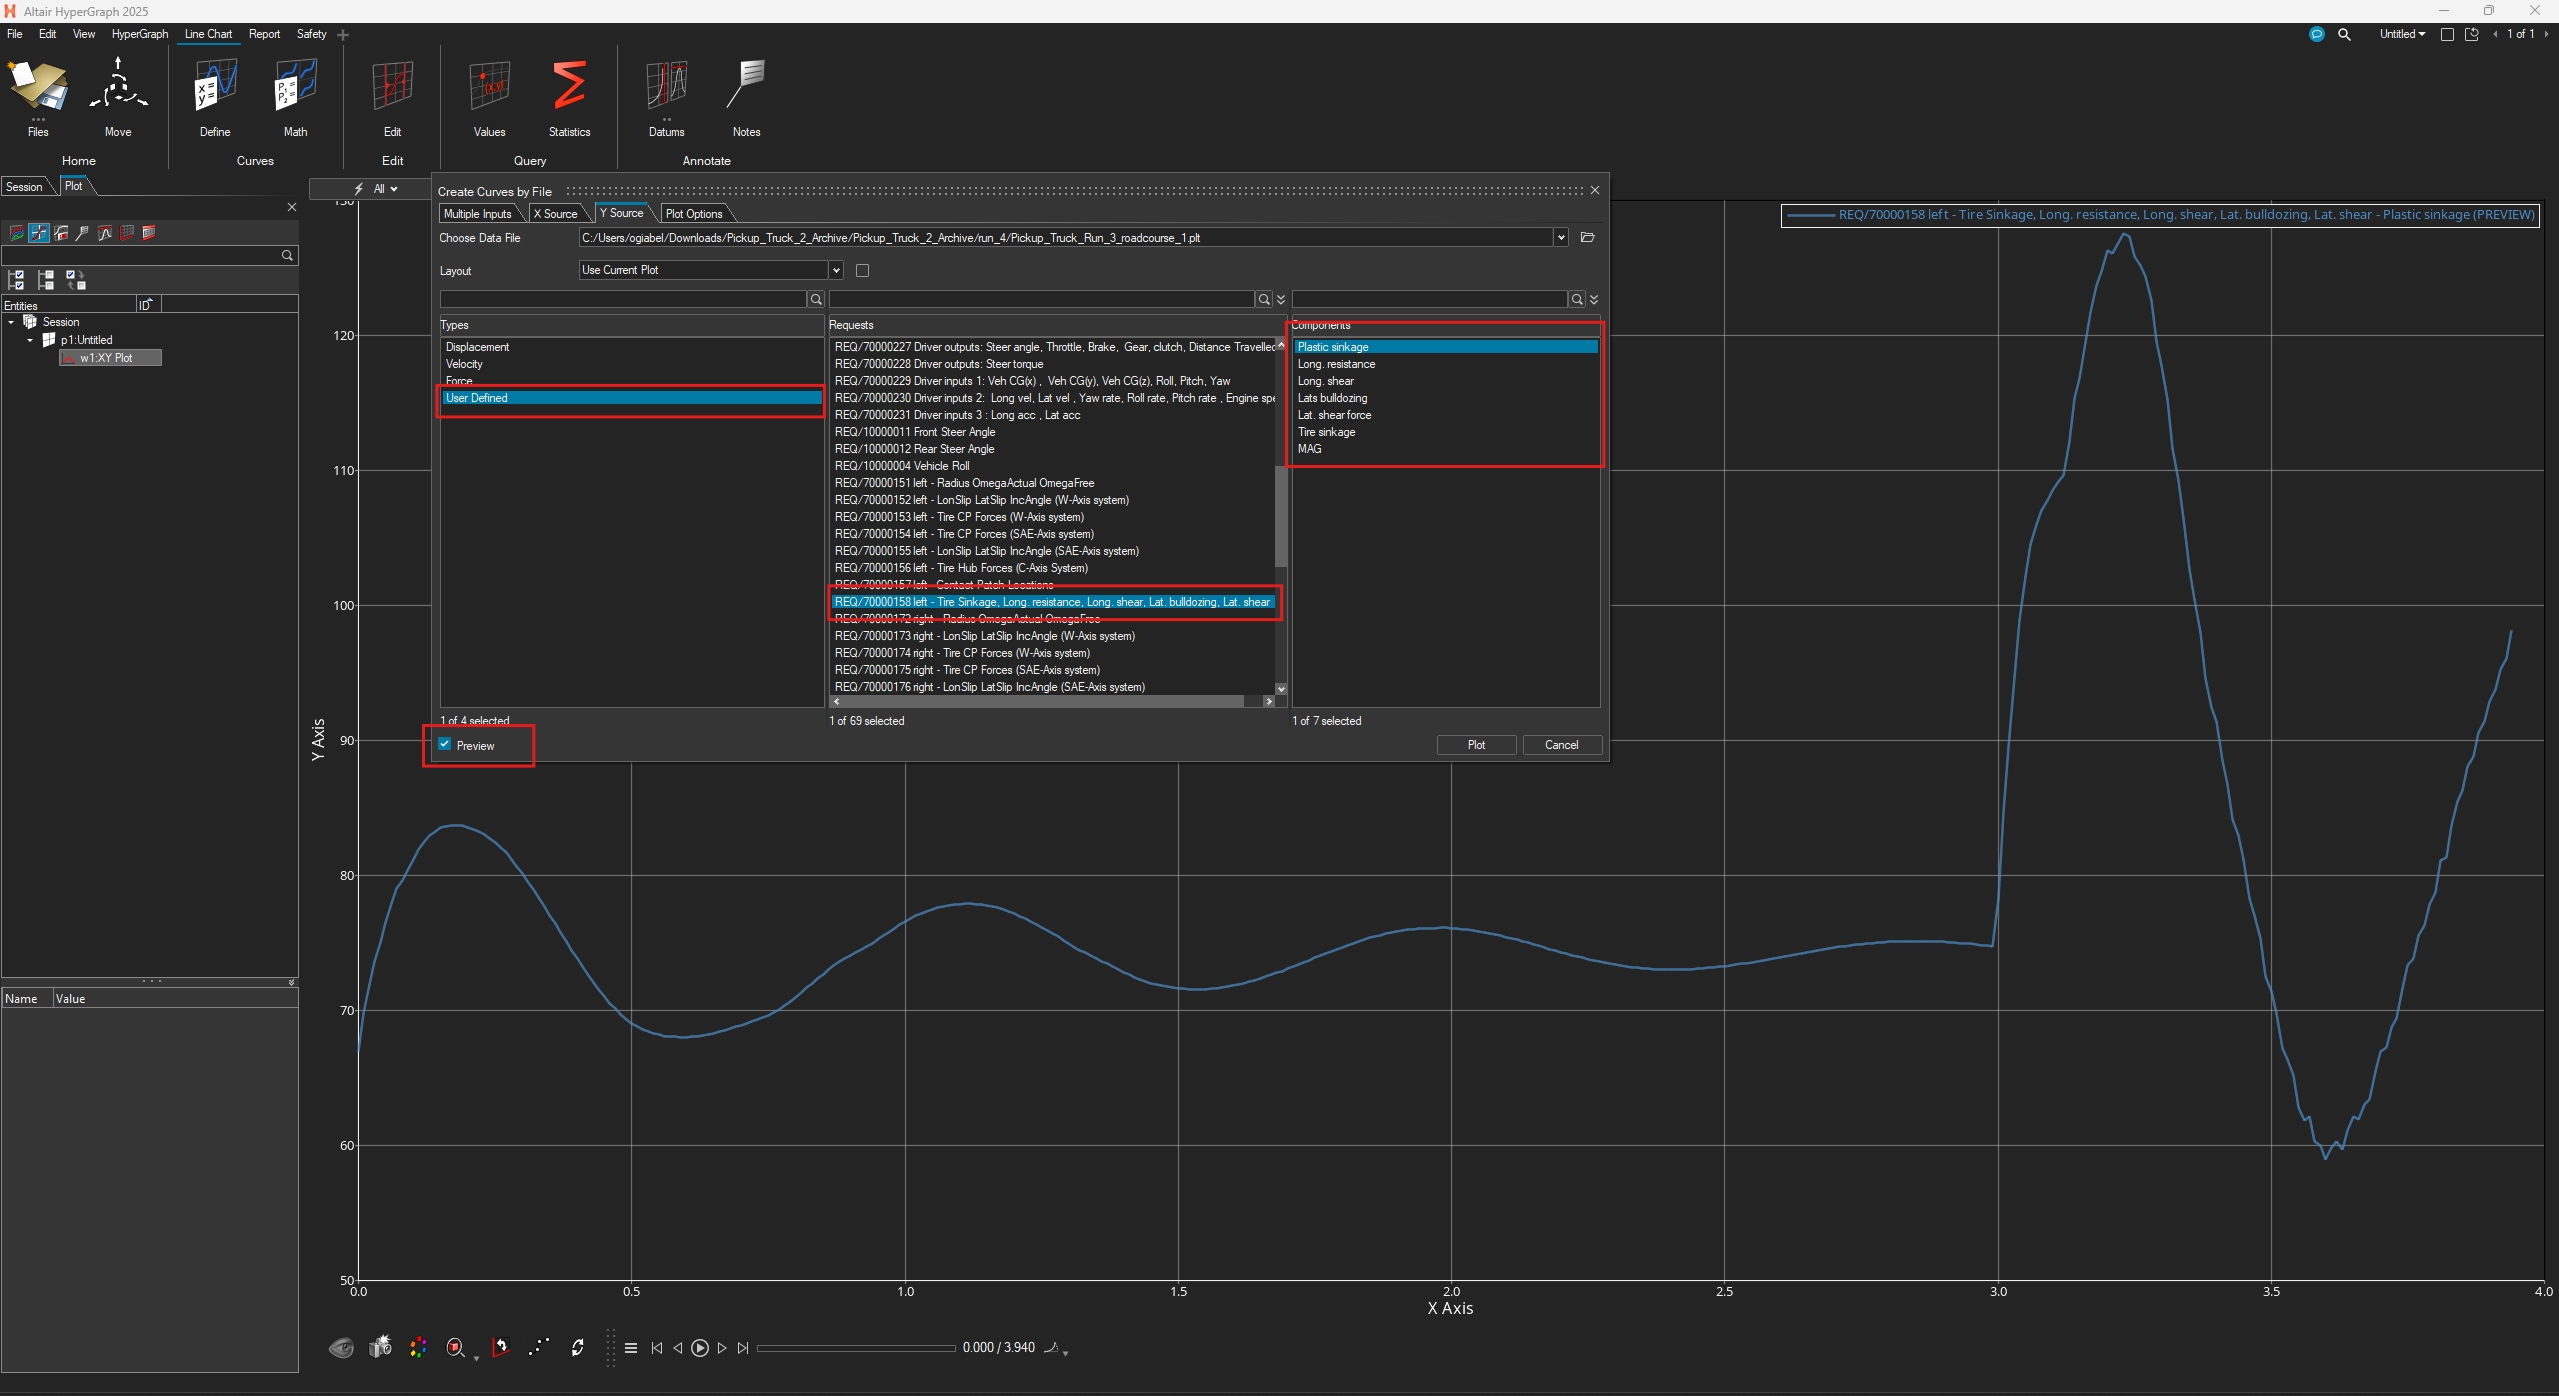
Load the results file in HyperGraph for any plot like shown below.
You can preview the result before plotting it by checking the preview option. If you are new to Multibody modeling and vehicle modeling, I would strongly suggest to go through our MotionView/MotionSolve Introduction eLearning and MotionSolve for vehicle Modeling eLearning.
Hope this helps! Best regards, Orestes
Thank you very much for your help and all the best!