Visualizing results is important to the understanding of a flow or thermal network. Flow Simulator can display results using text, color, or plots. Read this for a quick review of each type of post processing.
The first step is always to have a results file loaded into the FS user interface. The results file is automatically loaded after the solver is run, or the results file from a previous run can be loaded using File > Load Result File. The name of the loaded results file can be found at the bottom of the UI.

Text Results
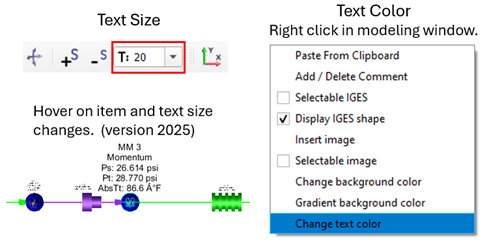
The results can be displayed as text next to the building block symbol (chamber, element, node, resistor). The user can control the items displayed, the text size, and text color.
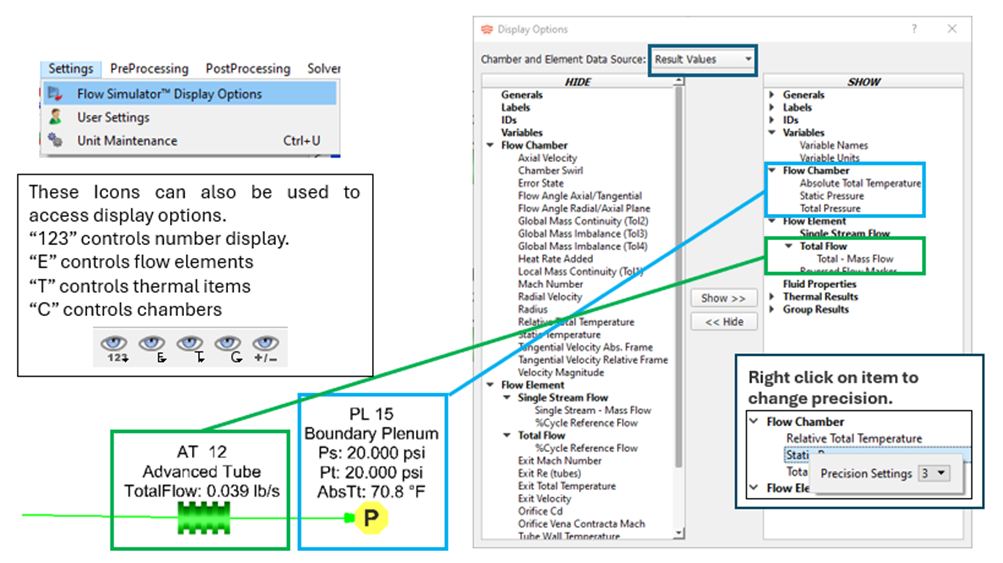
The “Display Options” window is used to control the specific items displayed (results, labels, item numbers) and the number of decimal places for the results. The “Display Options” window can be accessed from the Settings dropdown or using the eyeball icons as shown here. Move items between the HIDE column on the left and the SHOW column on the right by a double left click.
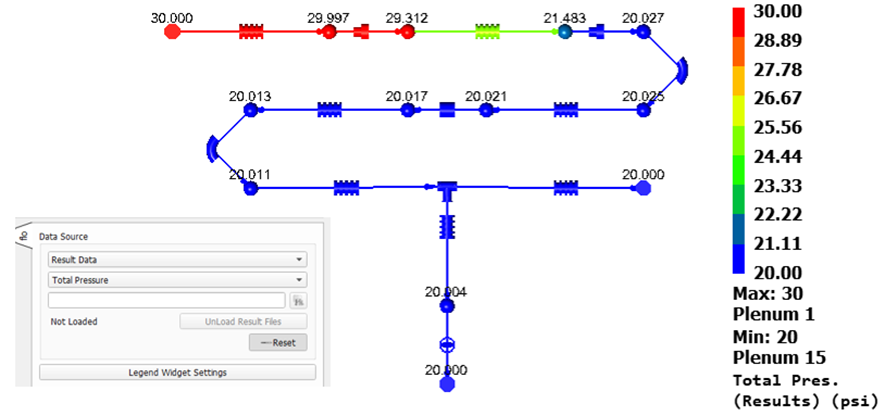
Color Results
The results of a single variable can also be displayed in color. The Color Contour and transient animation tool can plot results or initial guess values or element inputs. The element inputs color plots are a good way to find problems with inputs (ex: tube lengths and diameters).
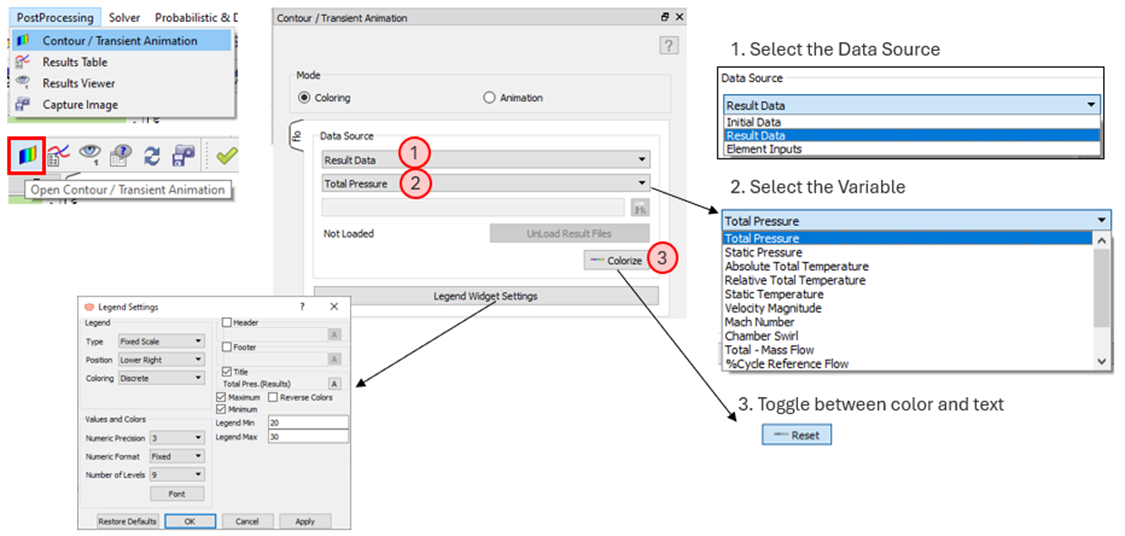
This tool helps visualize the entire model to easily find the most restrictive elements for example (large pressure changes).
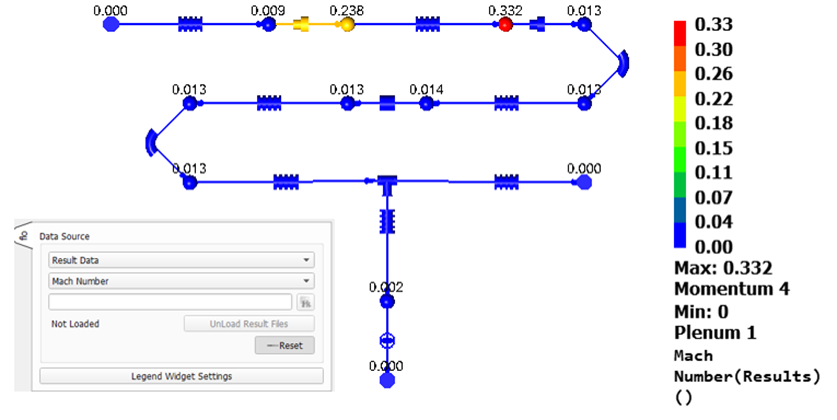
Or high velocities and Mach numbers.
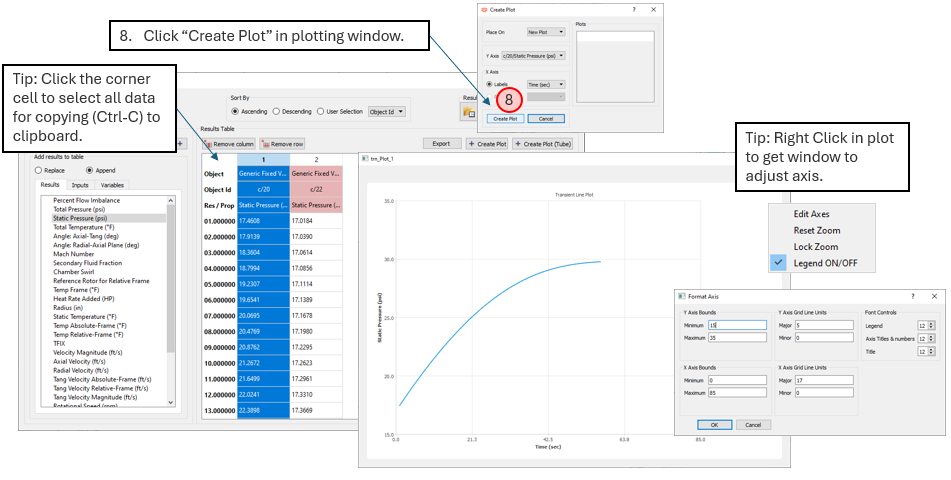
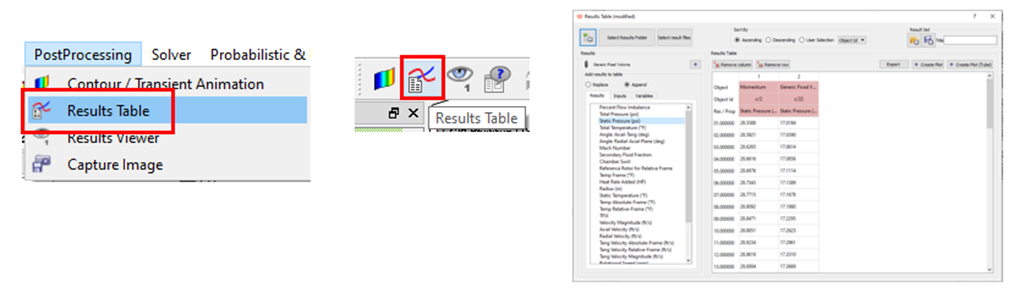
Tables and Line Plots
The last post-processing method is tables and line plots. This is most useful when there are multiple results files from a transient (plot results vs. time) or multi-case run (plot results vs input variable). The “Results Table” tool is used to select items to plot. If needed, the table can easily be copied and pasted into another plotting tool, like Excel.
This tool does not work on the results file loaded into the FS UI. So, the first step is to identify the folder containing the results file(s). Then select a modeling building block and a variable. The variable and building block selections should be saved to a file for easy retrieval to repeat the plot with another set of results.
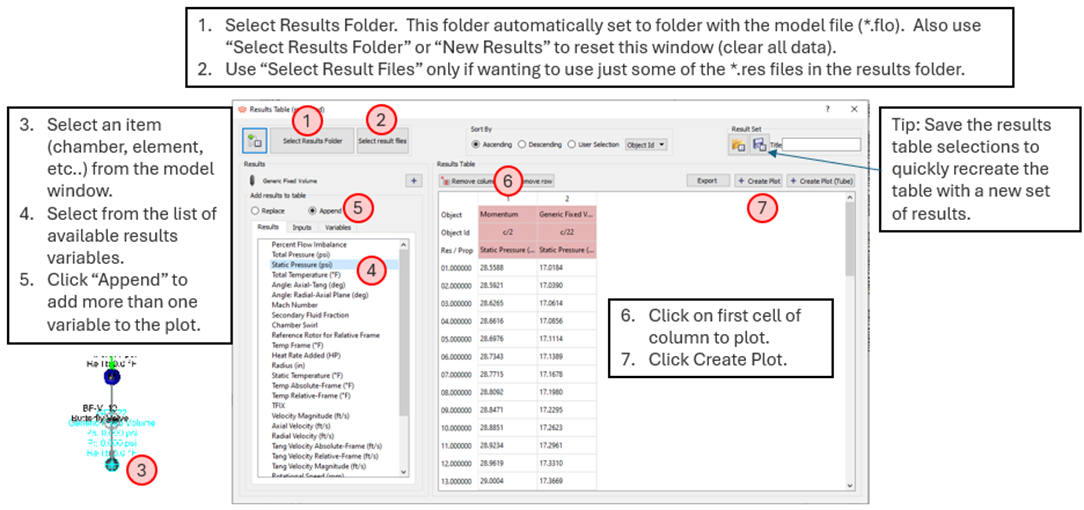
Once the table is created, line plots can be created.