Visualizing 3D simulation Results in HyperStudy
Hello HyperStudy users,
A new ‘3D Visualization’ feature has been added in HyperStudy from 2023.1 version. Using the 3D Visualization’ feature, users can visualize the 3D simulation model static results in HyperStudy (as shown below).
To understand the working of the ‘3D Visualization’ feature, kindly refer to the below mentioned procedural steps.
A. Once, the ‘Test Model’ step has been performed, click on ‘Media Sources’ tab & then, click on the ‘Find Media’ option to automatically add the .h3d results with default settings (as shown below).

B. To edit the 3D result visualization default settings, click on ‘…’ to select the settings of interest such as Subcase, Displacement, Element Stresses (2D& 3D), Averaging Mode etc. (as shown below).
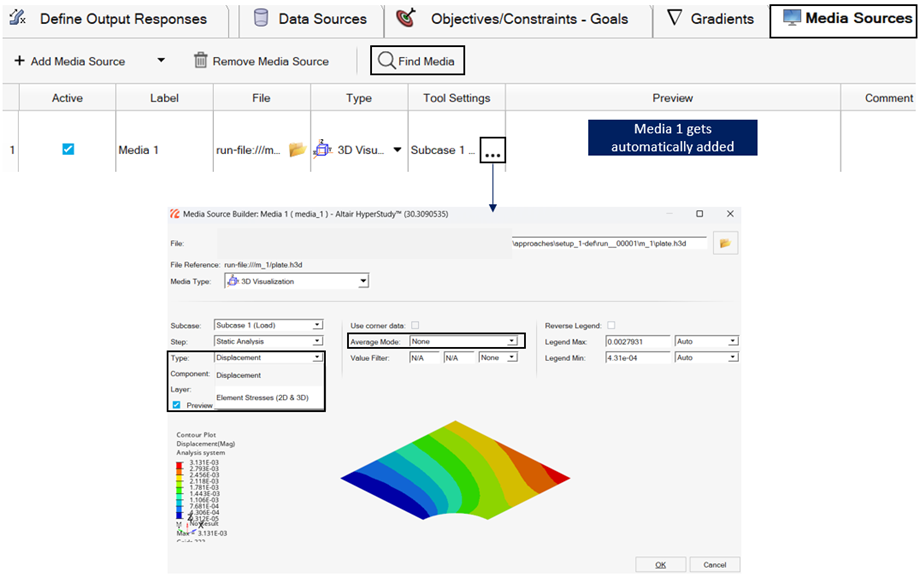
C. To add 3D visualization results for any other result type than Displacement, click on ‘Add Media Source’. Also, if any result file (such as .ODB) needs to be added for result visualization, then, one has to use the ‘Add Media Source’ as only .h3d files are automatically detected by default.
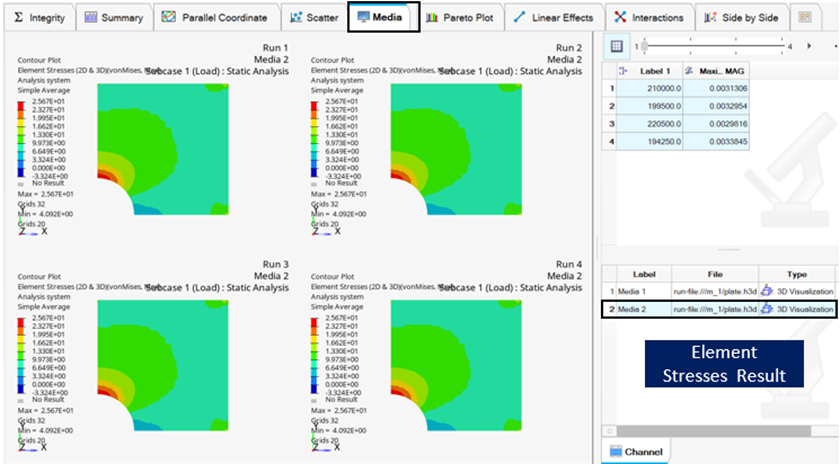
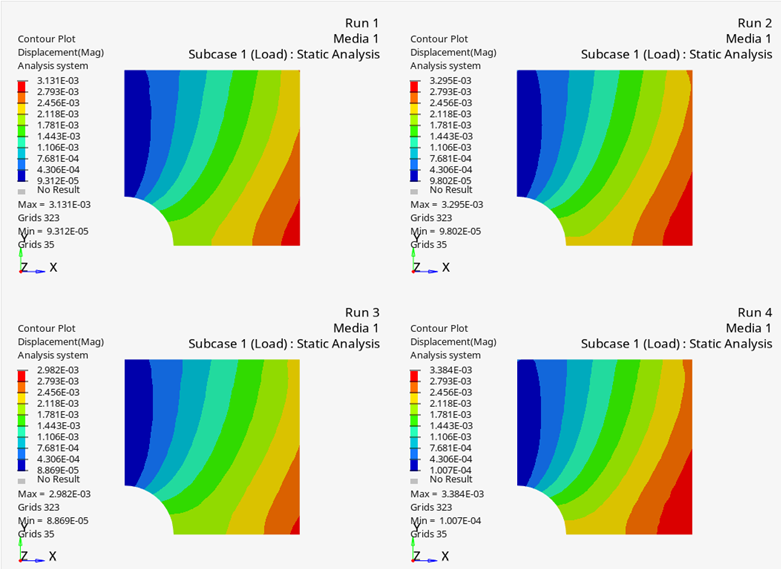
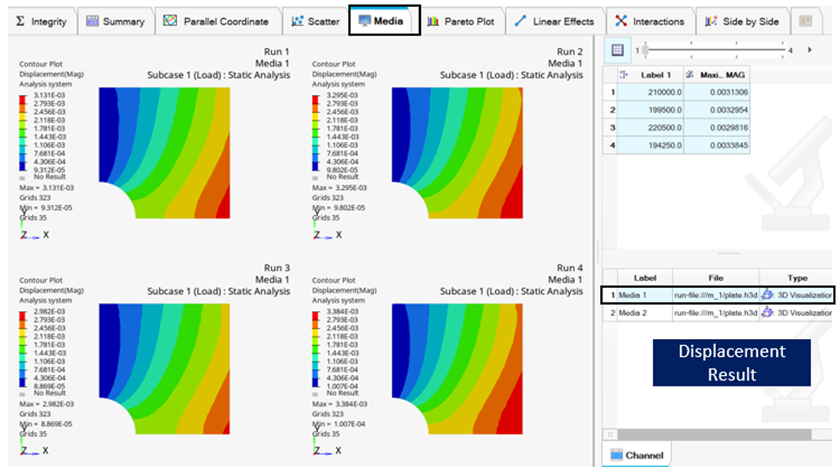
Thereafter, when DOE/Optimization studies are performed in HyperStudy, the 3D (static) results can be visualized automatically in the ‘Post-Processing >Media’ tab (as shown below).
Simultaneous ‘Displacement’ result visualization for the various DOE runs
Simultaneous ‘Element Stresses’ result visualization for the various DOE runs