The Siemens Community Catalyst program was co-created with our community to acknowledge technology leaders who consistently contribute to the Siemens Community. Nominations are accepted on a rolling basis.
Hi, is it possible to see in HyperView some marker (node maybe) changing position in time which comes from curve (f. ex. imported to hypegraph - postition vs ange - harmonic analysis)?
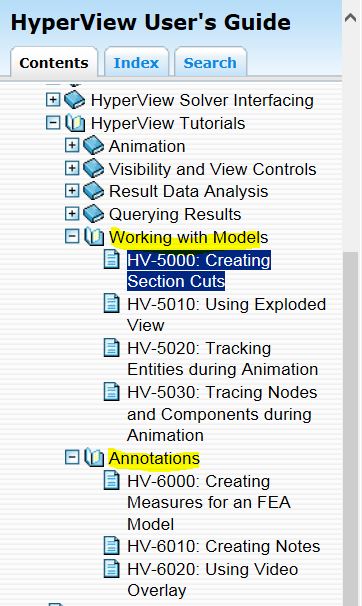
Refer any of these tutorials.It may help in your case.PFA
<?xml version="1.0" encoding="UTF-8"?>
I mean that case, that we can plot f.ex node Position in hypergraph (from hyperview), i want to ask, if it is possible to import curve to hypergraph and than make visualization on model that point movement (X,Y,Z axis)?
Join us for a Community Conversation where we'll discuss practical approaches to analyzing complex electromagnetic models using hybrid solver techniques. This session will provide a general overview of how different computational methods can be combined within a single simulation to address models containing varied…
Join us for a community conversation to explore how different modeling approaches in Simcenter PSIM can help engineers simulate power electronics systems while balancing accuracy, simulation speed, and design insight. What you'll learn: Power transistor modeling : Thermal and high fidelity models Protection component…