When working with an OptiStruct model that contains joint elements (JOINTG), it can be useful to review the joint force results as a vector. This article briefly explains how to do so using HyperView.
Here is an example setup illustrating this using RPIN joints. The setup is shown below in HyperMesh. The joint forces will be reviewed based on this test case. A single linear static subcase applies an SPC in DOF 123456 at the base of the first plate, which is connected to a second plate by RPIN joints. A horizontal load is applied via RBE2 on top of the second plate. To request joint force output for the RPIN joints to the H3D file, STRESS(H3D, ALL) = YES is added to the input deck.
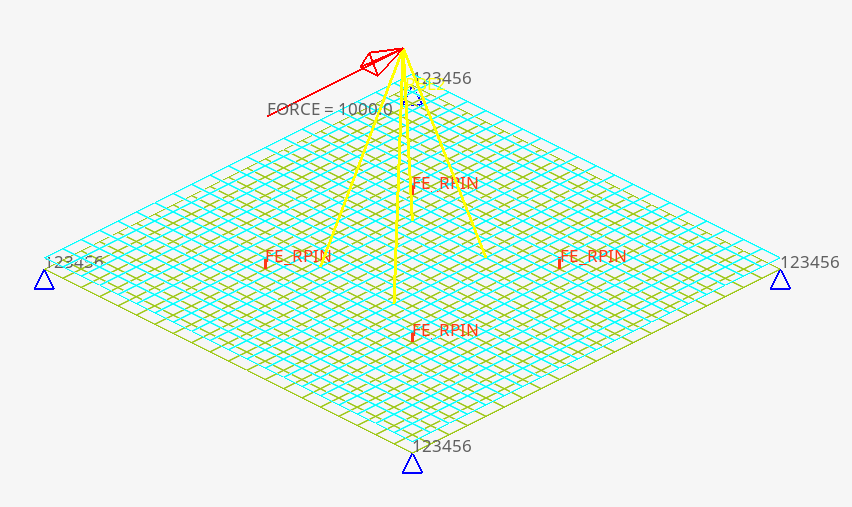
In HyperView, the results from the linear static analysis can be loaded from the H3D file and reviewed. The JOINTG Reaction Forces can be selected to contour plot the joint forces in X,Y,Z and moments about X,Y,Z axes on the joint elements.
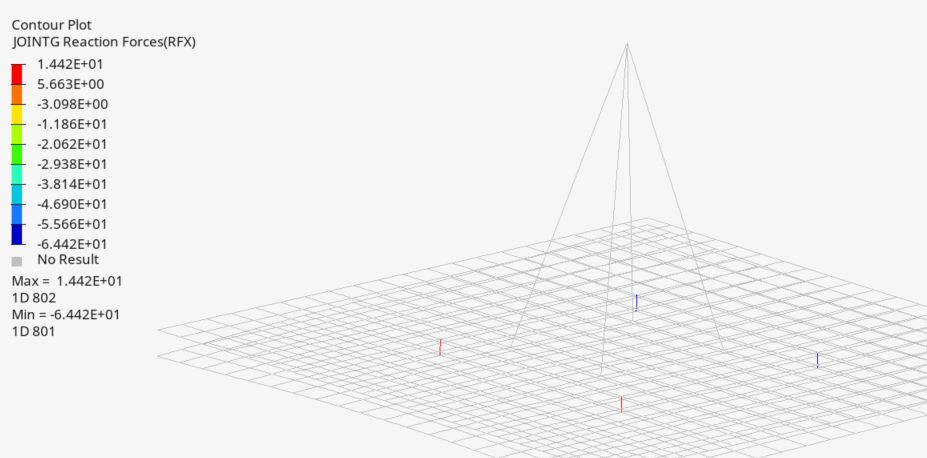
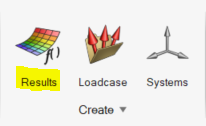
Here, the joint forces are plotted as a contoured value. To plot the contour information as a vector result instead, you can create a derived result. Click on the Results icon to open the Expression Builder.
In the Expression Builder, you can create derived results based on the results that are present in the h3d file. Here, you can create a label name for the expression (in our example, JointForceVector).
Selecting the VectorFromScalar option in the Math library will allow you to create a result that displays a vector result in HyperView as a function of different scalar results in x, y, and z.
By clicking on the VectorFromScalar option and clicking Insert for the different table options for the joint forces in X, Y, and Z, you can add the formula for the expression as below. There is also a help field which shows the arguments for the function.
In this example, the command VectorFromScalar(R2.S7,R2.S8,R2.S9,0) calls the joint reaction forces in X, Y, and Z in the global coordinate system:
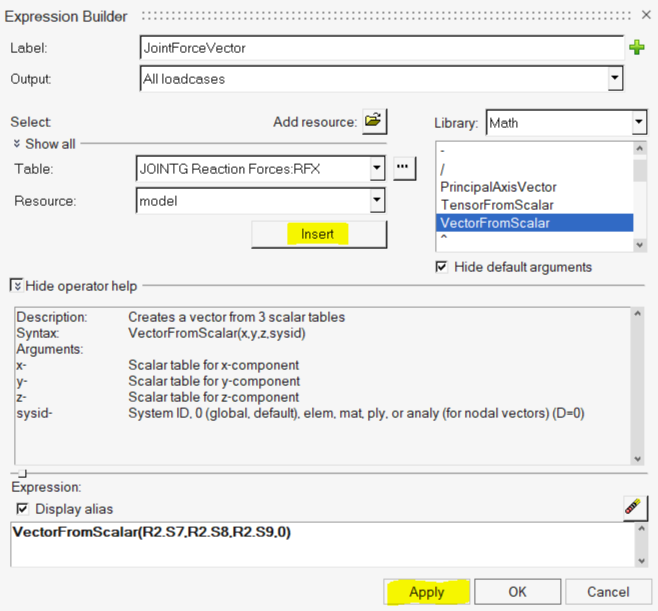
Finally, click Apply to create the derived result.
Next, click on Vector in the HyperView Plot options. Under Result type, click the label name for the expression, select the joint elements where you would like the vector result displayed, and click Apply. The joint reaction forces are displayed as a resultant vector or component, depending on the options chosen in the Plot tab.

Here is the result of the vector component plot with numerical results displayed (check the Values box).
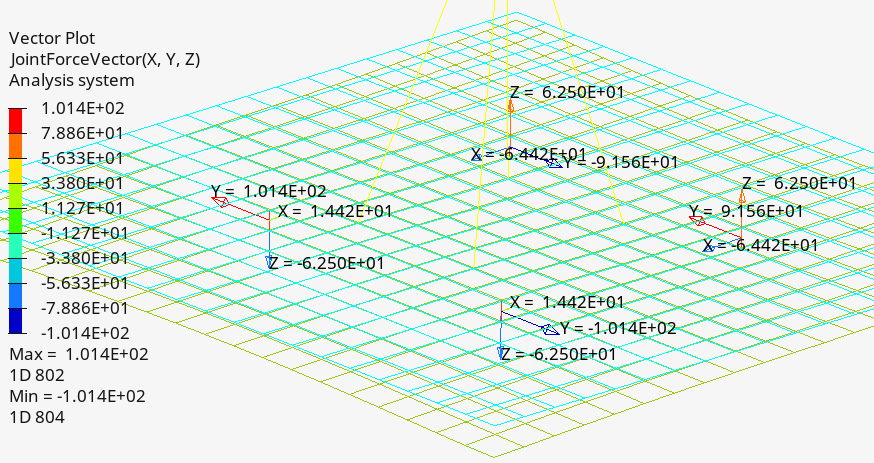
You can also change the display to resultant vector instead of individual components if desired.
Next Steps:
More information about using Joints with OptiStruct is available here:
https://2022.help.altair.com/2022.2/hwsolvers/os/topics/solvers/os/elements_user_guide_os.htm?zoom_highlight=JOINTG#ariaid-title7