Product = GENESIS
Introduction
Frequency response optimization capabilities in the GENESIS software allow its users to improve practically any type of results that come from structural frequency response analysis. Examples of responses that come from structural frequency response analysis are: displacements, velocities, accelerations, stresses, strain, and forces. Examples of objective functions associated to frequency response results that the GENESIS user can include in his/her optimization problem are:
- Minimize or maximize peak responses
- Minimize or maximize user equations of peak responses
Examples of constraints from frequency response results that the GENESIS user can include in his/her optimization problem are:
- Response (wi) <= Constant
- Response (wi) <= User Function (wi) (using shifted responses)
- Resonance Frequency (frequencies where peaks occur) >= Constant
- User equations of Response (wi) <= Constant
- Random Responses(wi) <= Constant
The ability to use bounds that are user-defined functions of frequencies can be achieved by the user using a unique capability in GENESIS called shifted responses. In this blog, we will demonstrate the use of shifted responses (DSHIFT data in GENESIS). Applications that users can use with these types of objectives and constraints are multiple, next we list some of them:
- Maximize modal dynamic stiffness or satisfy dynamic stiffness requirements
- Maximize point mobility or satisfy point mobility requirements
- Minimize sound pressure or satisfy sound pressure requirement
Example
Minimize Mass
s.t. LB (wi) <= Velocity (wi ) <= UB (wi) where, LB (wi) and UB (wi) are frequency dependent lower and upper bounds. These two sets of bounds are shown next.
Frequency Dependent Upper and Lower Bounds for a Frequency Dependent Velocity Response
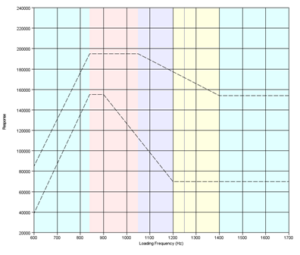
Figure 1
Figure 1 shows the lower and upper bounds as frequency dependent values. The bounds are shown for loading frequencies between 600 Hz and 1700 Hz. From the graph we can see that at 900 Hz the velocity cannot exceed 195,000 mm/sec and it cannot be below to 155,000 mm/sec.
Analysis
The frequency response analysis produces the following result:
Velocity Response at Initial Design
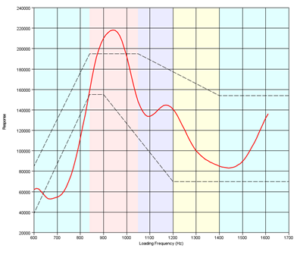
Figure 2
The red curve in Figure 2 shows the velocity of a point at different loading frequencies. The figure reveals that the velocities at 1000 Hz or lower are not feasible as at most loading frequencies the velocity value is either lower or higher than the allowable frequency dependent bounds. To obtain a curve that is feasible at all loading frequencies, we will optimize the structure using topometry optimization, which is an element-by-element sizing optimization type. Other optimization that we can use are topology, shape, topography and freeform.
Optimization Results
GENESIS successfully optimized the structure and key results are discussed next.
Velocity Response at the Final Design
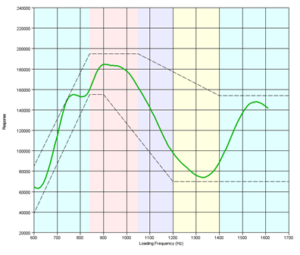
Figure 3
The green curve in Figure 3 shows the optimized velocity (wi). The figure shows that the velocity is now feasible as each point is within the two bounds. Note on how this problem was solved: In the next few paragraphs and figures, relevant steps are shown to illustrate the data creation process. It should be noted that only few steps are required to set up the problem. This section focuses on setting the upper bound constraint and its corresponding shifted constraint.
Step 1: Construct the Upper Bound Curve for the Shifted Response
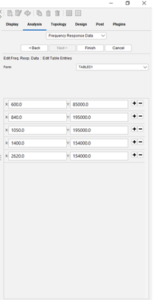
Figure 4
Step 2: Pick the bound of the shifted response and “More Responses Types”
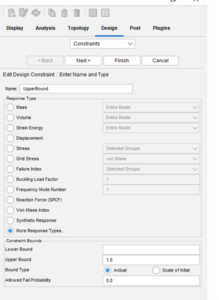
Figure 5
Step 3: Select the shifted velocity response
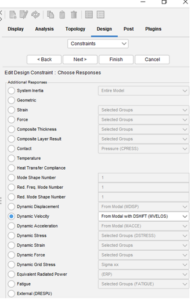
Figure 6
Step 4: Select the type of shifted response
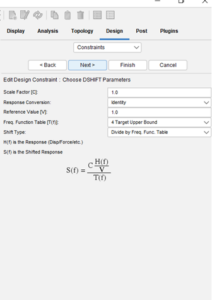
Figure 7
Summary
The GENESIS software can be used to optimize complex frequency response problems. This blog shows that we can control the velocities of a selected point so that it is contained between two curves that themselves are frequency dependent. 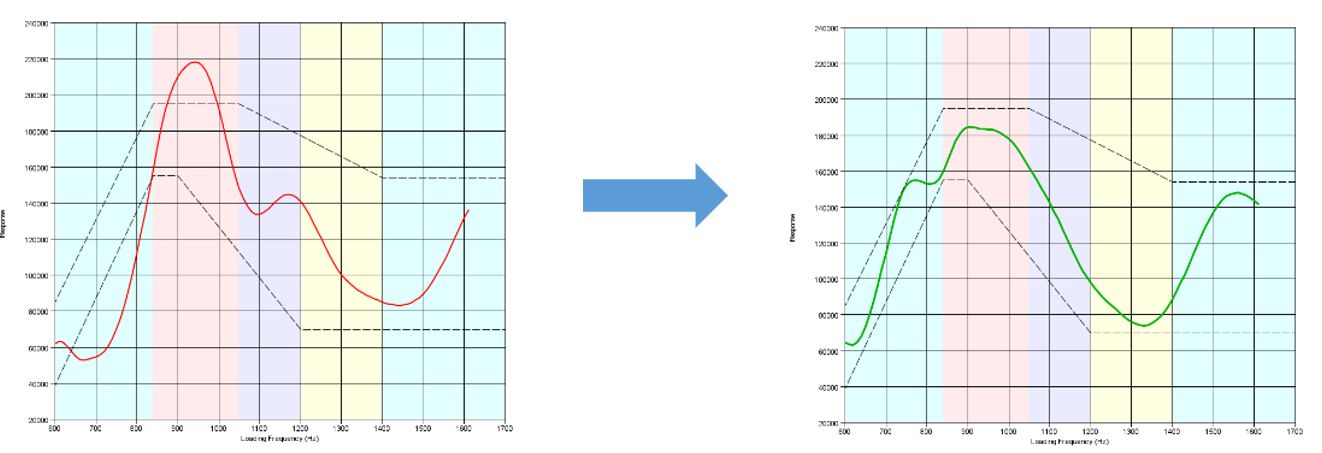
The data needed to solve this problem was created using Design Studio and the steps to create it were quite simple. Selected key steps were shown. To learn more about this type of problem, users can study the Design Studio using the step by step example manual (FRDSG009 example). If you currently do not have GENESIS and/or Design Studio, you can contact us for more information on how to get them.
Connect with us now for complimentary webinars and evaluation software.
Our engineering team can work with you to conduct a Test Case showing how how Genesis will improve your designs, processes and your overall business