Product = GTAM/GSAM
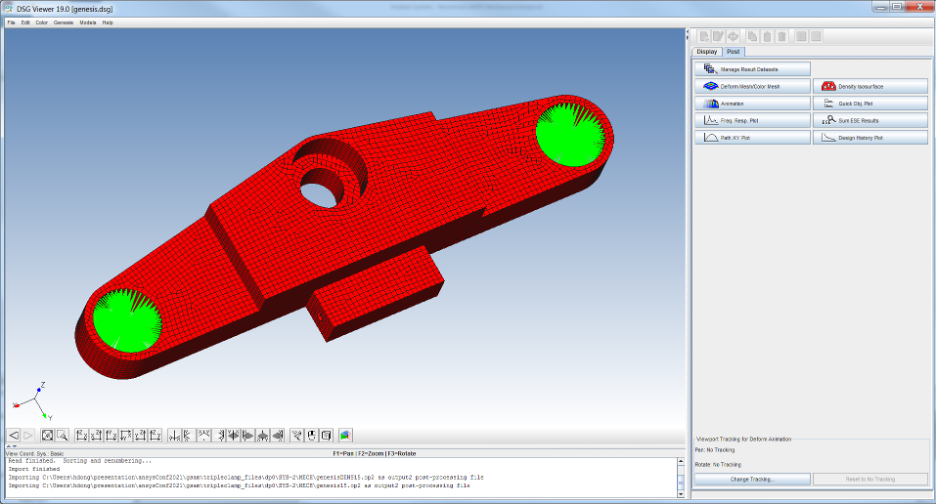
In the last article, we introduced the capability of ‘Show Result in DSG Viewer’, which allows us to check the results while optimization is running in Ansys Mechanical. In this article, we will show how to use DSG Viewer to post-process the results.
In DSG Viewer, the Post tab contains controls to construct views for analysis results or optimization results.
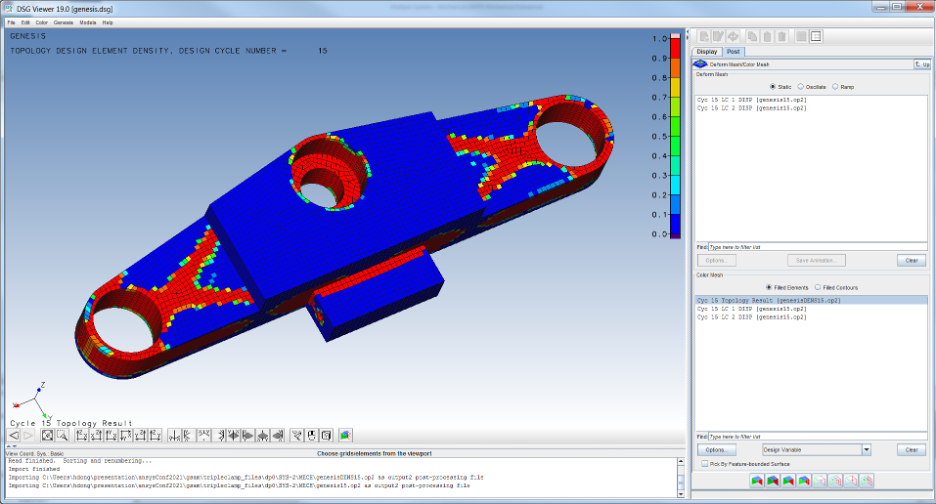
The ‘Deform Mesh/Color Mesh’ button allows you to display results in the Viewport Window. Displacement-like results can be used to deform the finite element model, and element or grid results (topology element density, element thickness, displacement, stress, and etc.) can be represented by colors drawn on the model.
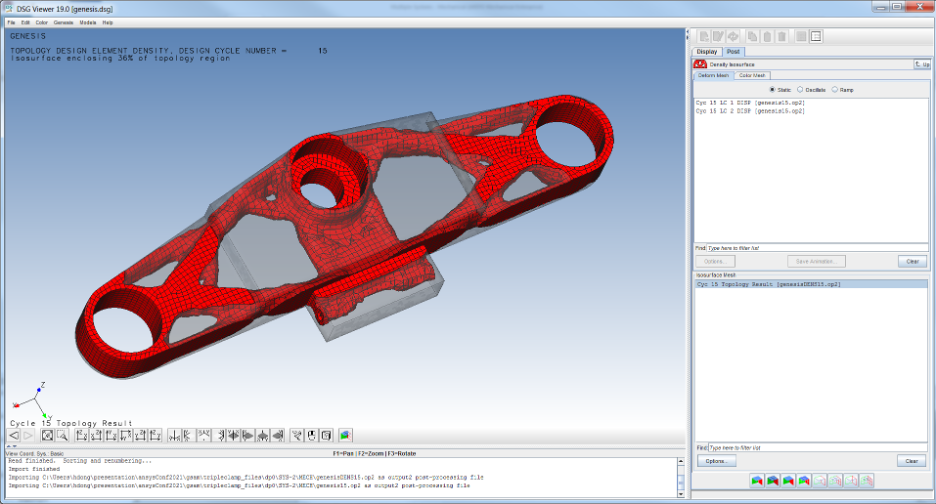
The ‘Density Isosurface’ button allows you to display topology results by drawing an isodensity surface.
To view the topology element density results, click on the ‘Deform Mesh/Color Mesh’ button from the Post tab, then select the topology result entry for a design cycle from the bottom ‘Color Mesh’ panel as shown below. Please note that the top ‘Deform Mesh’ panel is used to select the displacement result to deform the mesh, and the bottom ‘Color Mesh’ panel is used to select the topology result or other types of results to color the mesh.
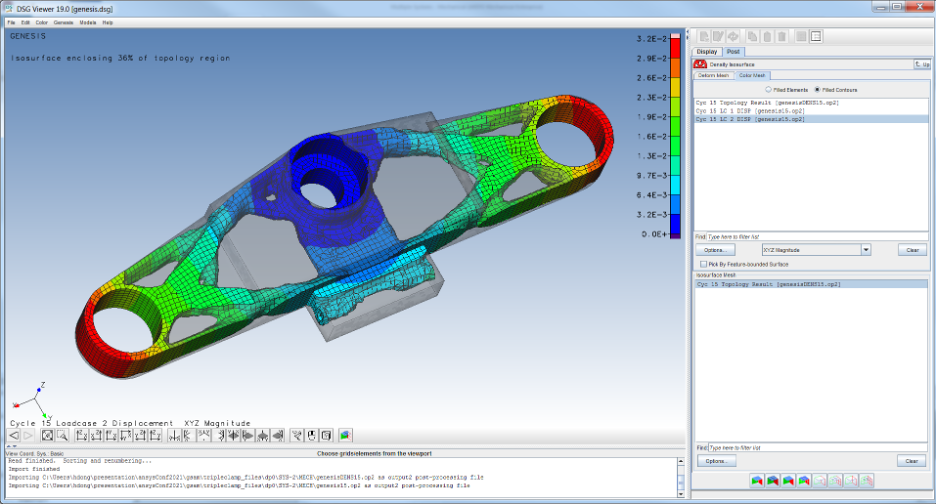
To view the density isosurface result, click on the ‘Density Isosurface’ button from the Post tab, then select the topology result entry for a design cycle from the bottom ‘Isosurface Mesh’ panel as shown in the image below. Similarly, the top ‘Deform Mesh’ panel is used to select the displacement result to deform the mesh, and the bottom ‘Isosurface Mesh’ panel is used to select the topology result for constructing the isosurface.
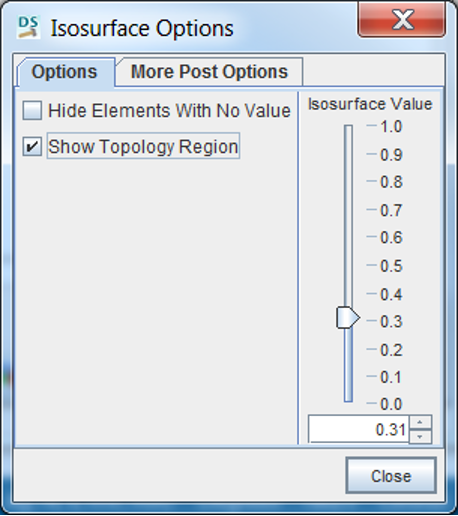
To adjust the cutoff value for the density isosurface, you can click on the ‘Options’ button, which will pop up a new dialog as shown in the following image. Optionally, you can choose to turn on/off the topology region, which will be displayed as transparent.
Another advanced option is to overlay the color result with density isosurface. You probably already noticed that there is another ‘Color Mesh’ tab next to the ‘Deform Mesh’ tab on the top panel. This is a relatively new capability added in Design Studio which allows you to display a color result (element density, displacement, stress, and etc.) onto the density isosurface. The steps are as follows:
- First select a topology result in the bottom ‘Isosurface Mesh’ panel
- Then select the ‘Color Mesh’ tab on the top panel
- Last, choose a result set for the color mesh
For example, we can overlay the topology element density color result with the density isosurface or overlay the displacement color result with the density isosurface as in the following images. Please note that the Filled Contour option is selected to show a nodal value.

Design Studio Viewer also provides other advanced capabilities such as animation creation, model cutaway view, and etc. Please refer to Design Studio Manual for more details.
In summary, this ‘Show Result in DSG Viewer’ function in GSAM/GTAM provides several benefits:
- Check the results early on to find out issues in the optimization setup
- Check how the optimization progress, and understand if the results make sense
- Access advanced post-processing capability in Design Studio for GENESIS: for example, model cutaway view, overlay of analysis results with topology density isosurface, and etc.
Hope this article is helpful for you to learn about DSG viewer for post-processing results. If you have more questions please leave a comment below.
