Hi,
Need help in finding the frequency value of the signal samples in a text file.(attached)
In the text file, the first column represents the time and the second column represent the output value.System properties setup is shown below.
I tried few examples available in embed to find the frequency value.
- In a plot block by selecting the “Frequency Domain” option located in the “plot/Options” tab.
- Another way by using FFT block
I am not sure whether its showing correct frequency value for the set of samples and is this the way to find frequency value or any other way.
Please help me out in finding the frequency value for this example.
Thank you,
Regards,
Priyanka
<?xml version="1.0" encoding="UTF-8"?>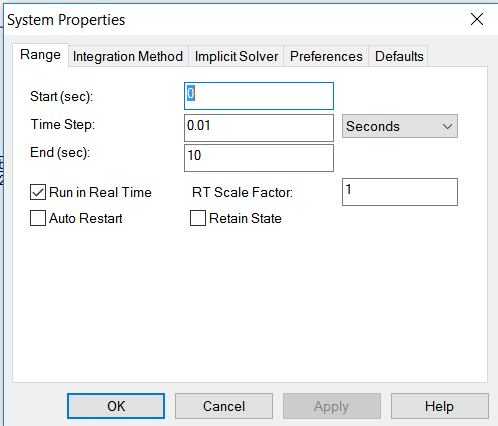
Unable to find an attachment - read this blog
