How to plot curves with both option 'color' & dash line '--'

User: "alpha_21885"
Altair Community Member
Updated by alpha_21885

Hi Compose Experts,


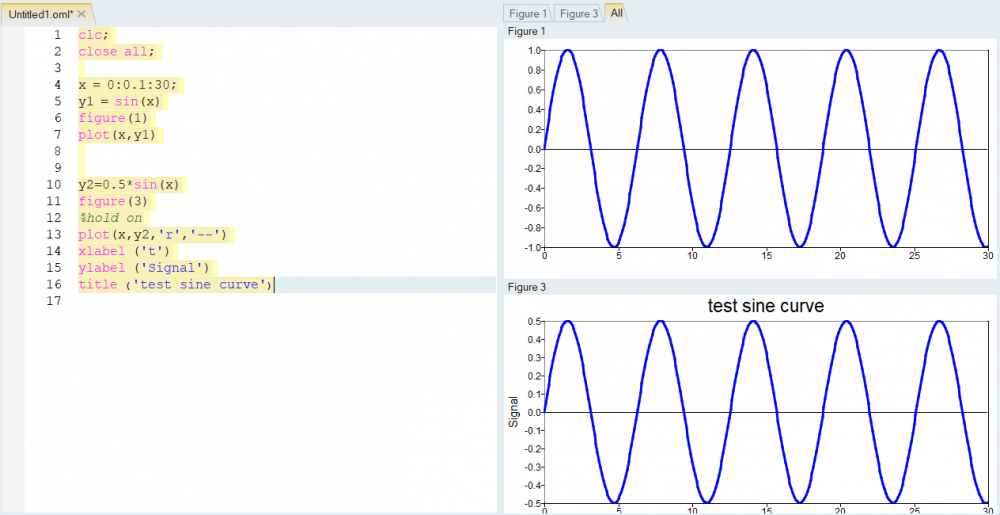
I tried to plot curves with both option 'color' & dash line '--'. But it does not work and sometimes software crashes and suddenly shut down.

Thanks for your input and advice.


clc;
close all;

x = 0:0.1:30;
y1 = sin(x)
figure(1)
plot(x,y1)


y2=0.5*sin(x)
figure(3)
%hold on
plot(x,y2,'r','--')
xlabel ('t')
ylabel ('Signal')
title ('test sine curve')


<?xml version="1.0" encoding="UTF-8"?>image.thumb.png.ad9a1a02fb3604e3201fc67e61a3a27e.png
Find more posts tagged with

Sort by:
1 - 1 of 11
    User: "alpha_21885"
    Altair Community Member
    OP
    Updated by alpha_21885

    Sorry. I already found the solutions for my question. Use 'r --' instead of 'r','--'

    <?xml version="1.0" encoding="UTF-8"?>image.thumb.png.06f8fc0fc586579cb9e7ee54feda2ba5.png