Hi Compose Experts,
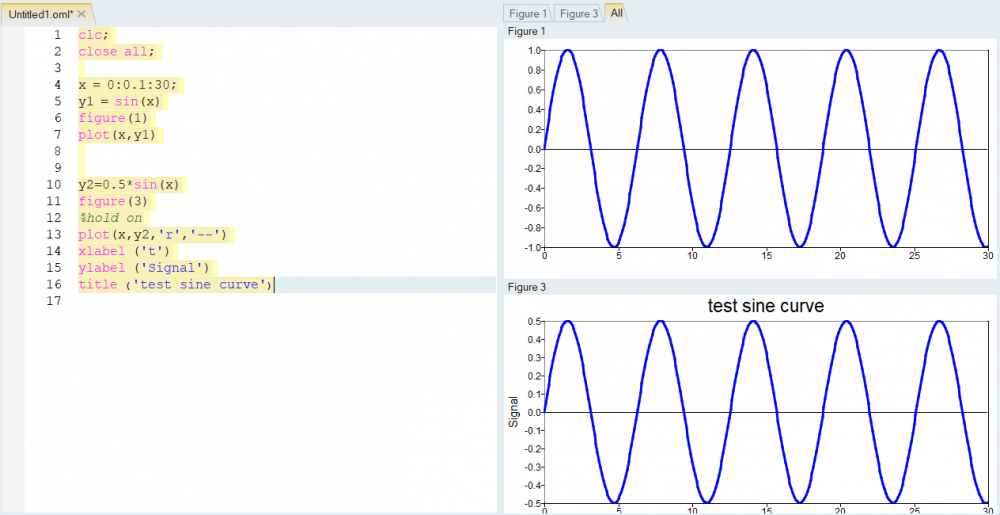
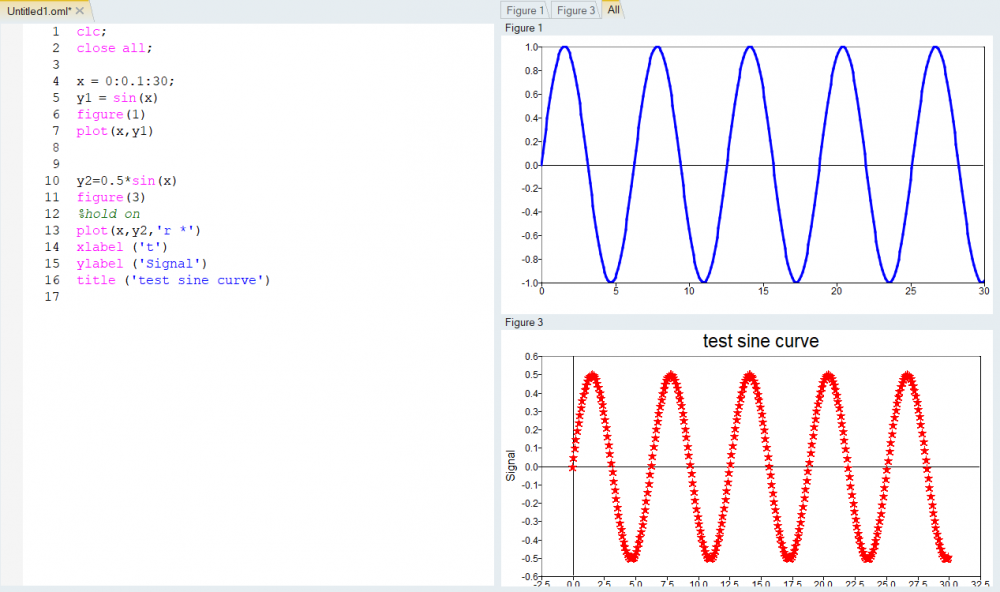
I tried to plot curves with both option 'color' & dash line '--'. But it does not work and sometimes software crashes and suddenly shut down.
Thanks for your input and advice.
clc;
close all;
x = 0:0.1:30;
y1 = sin(x)
figure(1)
plot(x,y1)
y2=0.5*sin(x)
figure(3)
%hold on
plot(x,y2,'r','--')
xlabel ('t')
ylabel ('Signal')
title ('test sine curve')
<?xml version="1.0" encoding="UTF-8"?>