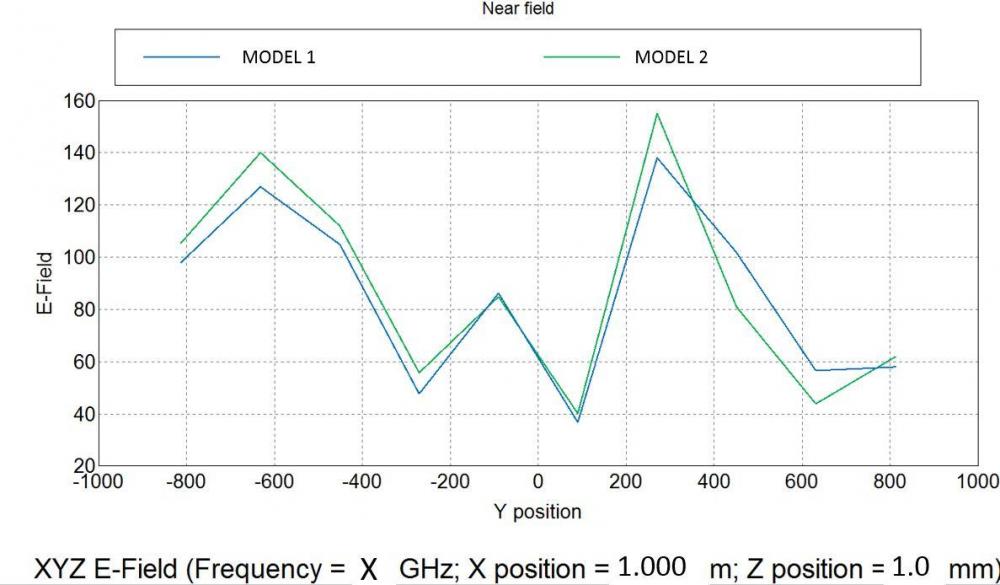
I have 2 models for which, E field (Y axis) is plotted against a given 'Y position' in X axis (Independent axis).
In fixed category: Freq - single/one, X position --> 10 positions, Z position --> 1 position.
I need script (a) To plot, all X position 10 positions (same for both models) for 2 models for given Y position (b) export plotted curves into single *.dat file
Data from *.out file & creating plot in spread sheet takes more time.
<?xml version="1.0" encoding="UTF-8"?>