The Siemens Community Catalyst program was co-created with our community to acknowledge technology leaders who consistently contribute to the Siemens Community. Nominations are accepted on a rolling basis.
Hi,
I want to visulaize displacement in each frame in hyperview. but when i move the different frames the color map and the legend is not changing.
Any idea how to fix that?
Hi moeen
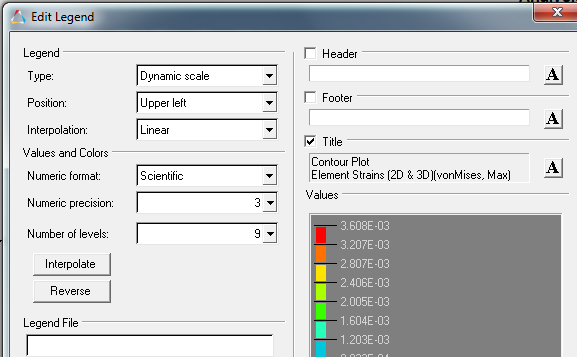
click > legend > edit legend >type >dynamic scale
Hi moeen click > legend > edit legend >type >dynamic scale <?xml version="1.0" encoding="UTF-8"?>
<?xml version="1.0" encoding="UTF-8"?>
This does not worked. I am running a linear elastic analysis
Yes its true , since results of static analysis doesn't changes with respect to time ,dynamic results are not available .
Hello,
Dynamically changing the legend for a static analysis makes little sense. It makes much more sense to display the contour plots dynamically.
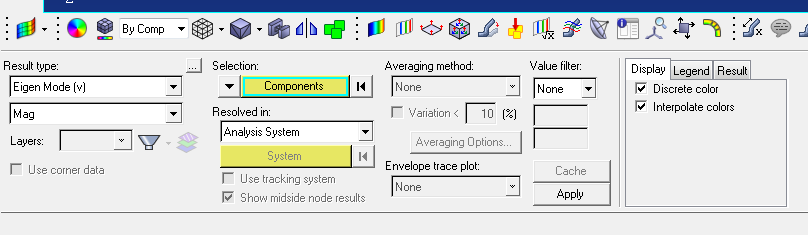
You can do that by turning on the contour panel-> display-> interpolate colors. (see picture)
Best regards,
Mario
Join us for a community conversation on how High-Performance Computing (HPC) and Simcenter PSIM work together to meet the increasing demands of modern power electronics simulation. During this one-hour technical session, you'll discover how leveraging HPC can speed up simulations, improve scalability, and empower engineers…
Join us for a community conversation on accelerating your motor simulation workflow with Simcenter Simlab. In this beginner-friendly session, we'll introduce the platform's automated model-building capabilities and show how easy it is to set up your first electric motor analysis. You'll see the basic steps of geometry…
Join us for a Community Conversation where we'll discuss practical approaches to analyzing complex electromagnetic models using hybrid solver techniques. This session will provide a general overview of how different computational methods can be combined within a single simulation to address models containing varied…