Dear all,
I'm trying to create a 2D plot of a 3D map using the contour fucntion.
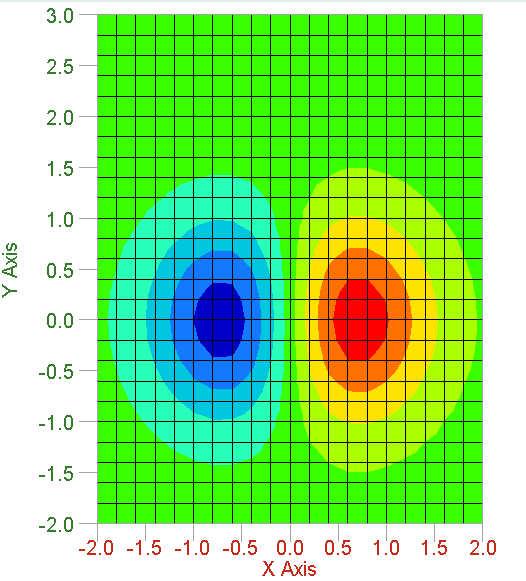
The following code is already a valid basis, i.e. it creates the plot below:
x = -2:0.2:2;
y = -2:0.2:3;
[X,Y] = meshgrid(x,y);
Z = X.*exp(-X.^2-Y.^2);
contour(X,Y,Z);
What I would like to have instead, is lines instead of surfaces and labels showing the value of each line (e.g. like the image below).
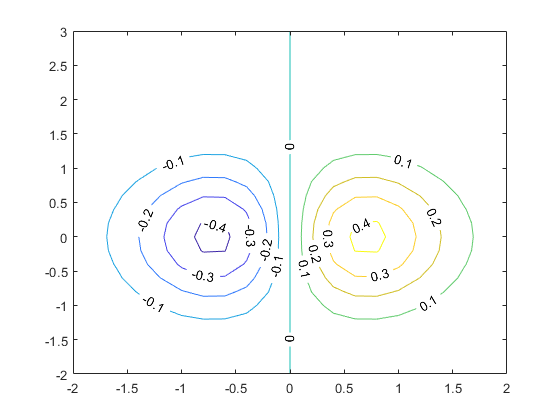
Is there a way to realize this in Compose?
Thank you in advance!
Christian
