The Siemens Community Catalyst program was co-created with our community to acknowledge technology leaders who consistently contribute to the Siemens Community. Nominations are accepted on a rolling basis.
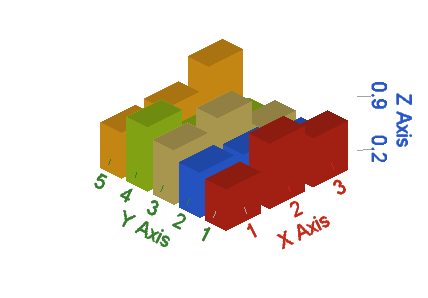
Is there a possiblity to plot bar chart in 3D.
In the version 2017.3 it looks like only 'bar' plot is supported.
what about 'bar3'?
In 2017.3 it not available, but it's coming soon /emoticons/default_smile.png' srcset='/emoticons/smile@2x.png 2x' title=':)' width='20' />
Hi BeLlng,
Bar3 is supported in next release (in next 2 months).
With Compose as an IDE ,we can leverage Python bridge to achieve the task of plotting the 3D bar, (as it is not yet supported). I have created a simple example( as attached) for doing so.
I'm not sure if you have prior experience with python, but I have attached python bar3 help document as well for your reference. https://matplotlib.org/2.0.2/mpl_toolkits/mplot3d/api.html.
If you have any questions regarding python bar3 example file or if you have any specific requirements let me know, i'm more than happy to help you..
Steps:
1. download the files in a folder
2. open test.oml and Hit Run (you will see bar3 plot in python console.)
if you want to try it with your data, just replace foodat with your variable in line 5. ('exporttopython(foodat,'data');')
Unable to find an attachment - read this blog