The Siemens Community Catalyst program was co-created with our community to acknowledge technology leaders who consistently contribute to the Siemens Community. Nominations are accepted on a rolling basis.
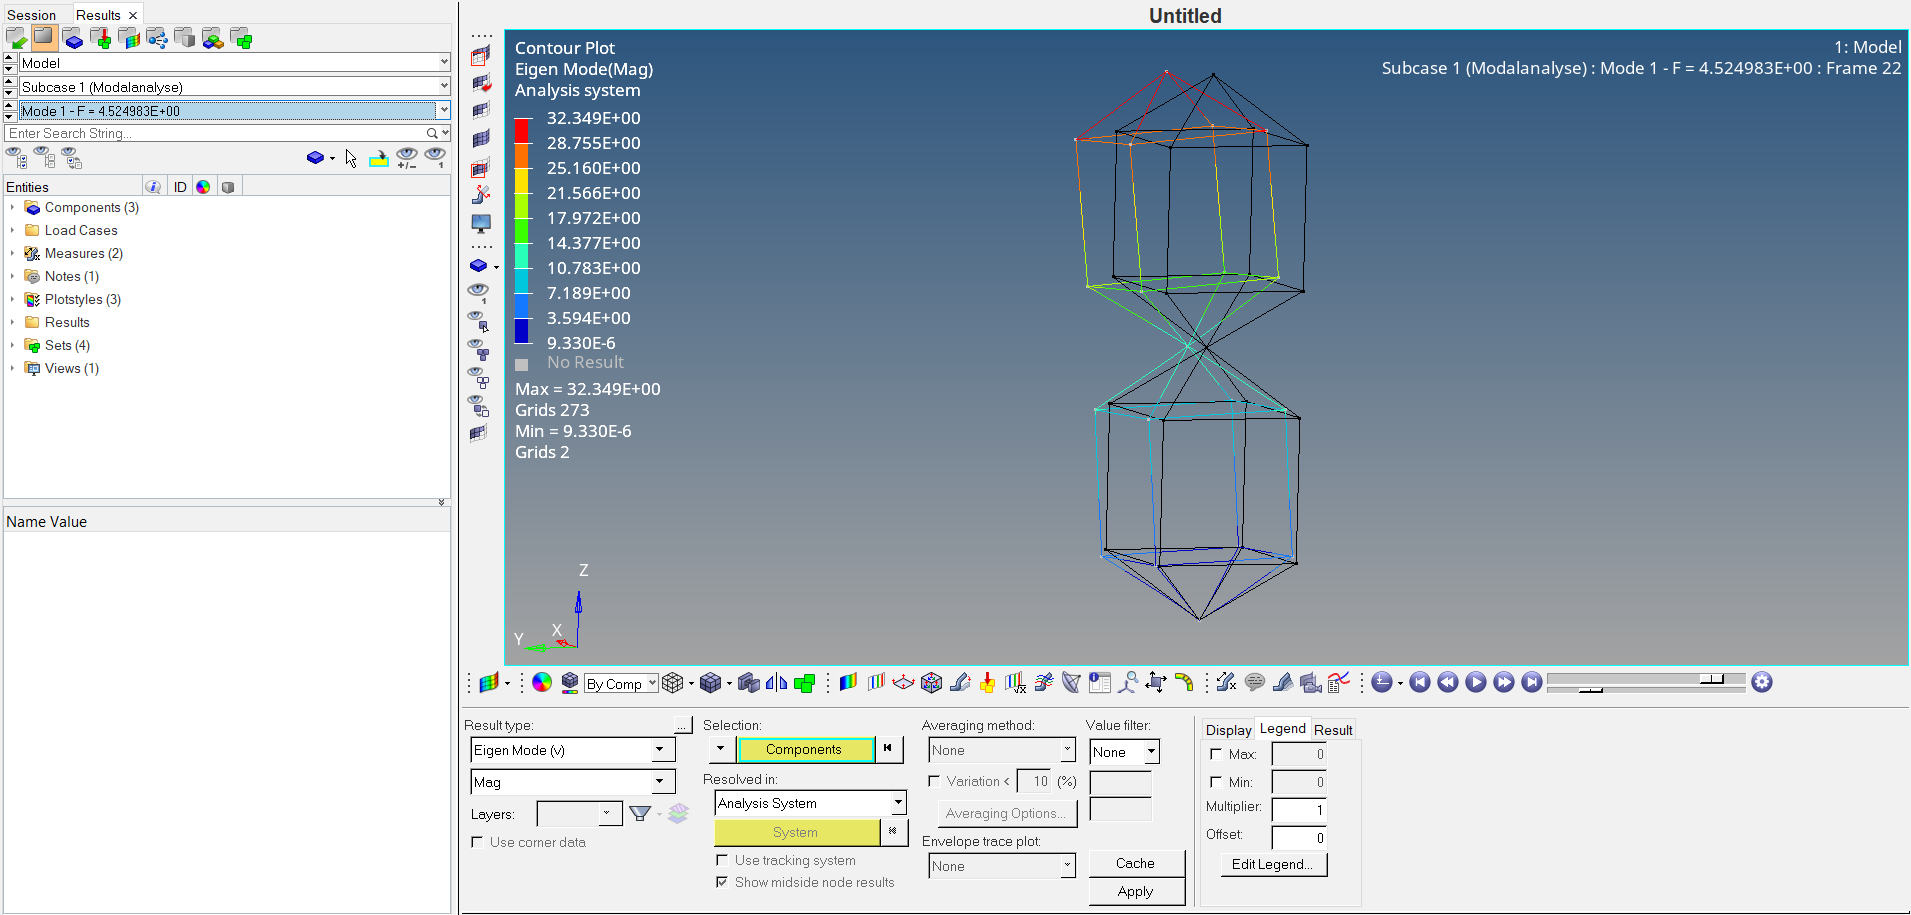
Hello, i have a question about the function "Contour" in HyperView. I don't understand the values of the Contour Plot in case of a Modal Analysis. My Model has 65 modes in the range from 0-500Hz, but the Contour Plot shows values, which probably have nothing to with the values of the modes. Can anyone help me, what these values stand for?