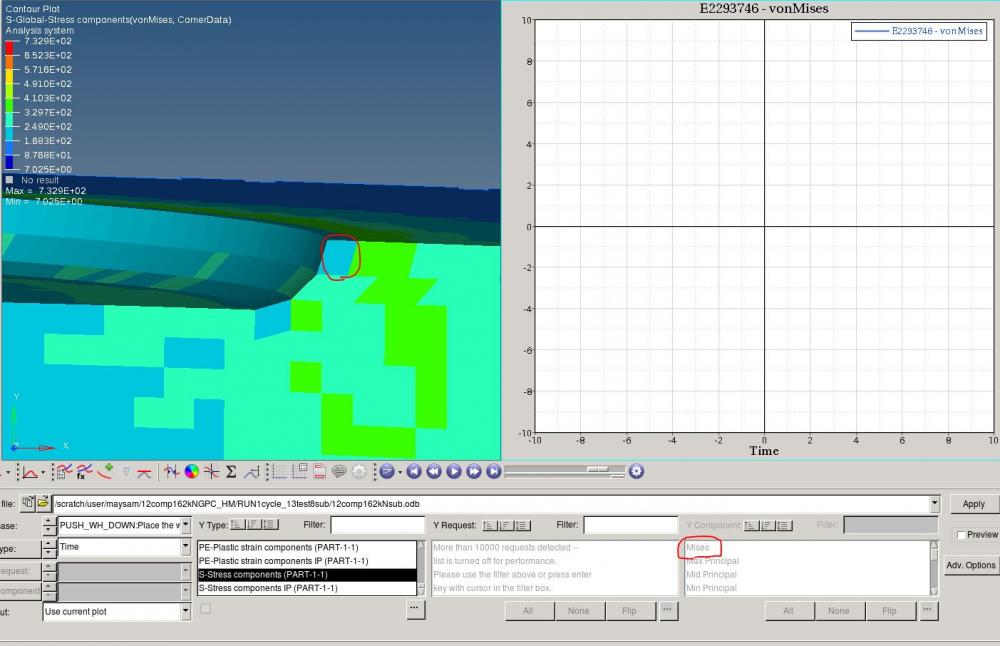
plot an element's stress vs time
Answers
-
Even when I just use the 'Build Plots' button in HyperView then select what I want to be plotted for a specific element, it just doesn't plot anything
The time history shows the change of von Mises correctly and I just want a simple plot of it versus time! I'm really confused! What am I missing!!?
0 -
Altair Forum User said:
I'm trying to plot an element's von mises stress vs time but mises is deactivated when i want to choose it for y-axis. I'm new to HyperView. Could anyone help me figure this out?
Attached screenshot shows the issue.
Thanks,
Maysam
Hi Maysam,
Please type the element number near the Y-Request filter and select the element from the list. Then choose the Y component and try to plot the graph.
0 -
Altair Forum User said:
Even when I just use the 'Build Plots' button in HyperView then select what I want to be plotted for a specific element, it just doesn't plot anything
The time history shows the change of von Mises correctly and I just want a simple plot of it versus time! I'm really confused! What am I missing!!?
<?xml version="1.0" encoding="UTF-8"?>
Hi Maysam,
Can you try the same by selecting the element id (Clicking on elements in request panel>>by ID>>give the element id>>add) and plot?.
If not working,please share the files to the dropbox.
0